Ottawa vs Portuguese Disability
COMPARE
Ottawa
Portuguese
Disability
Disability Comparison
Ottawa
Portuguese
14.2%
DISABILITY
0.0/ 100
METRIC RATING
327th/ 347
METRIC RANK
12.6%
DISABILITY
0.1/ 100
METRIC RATING
270th/ 347
METRIC RANK
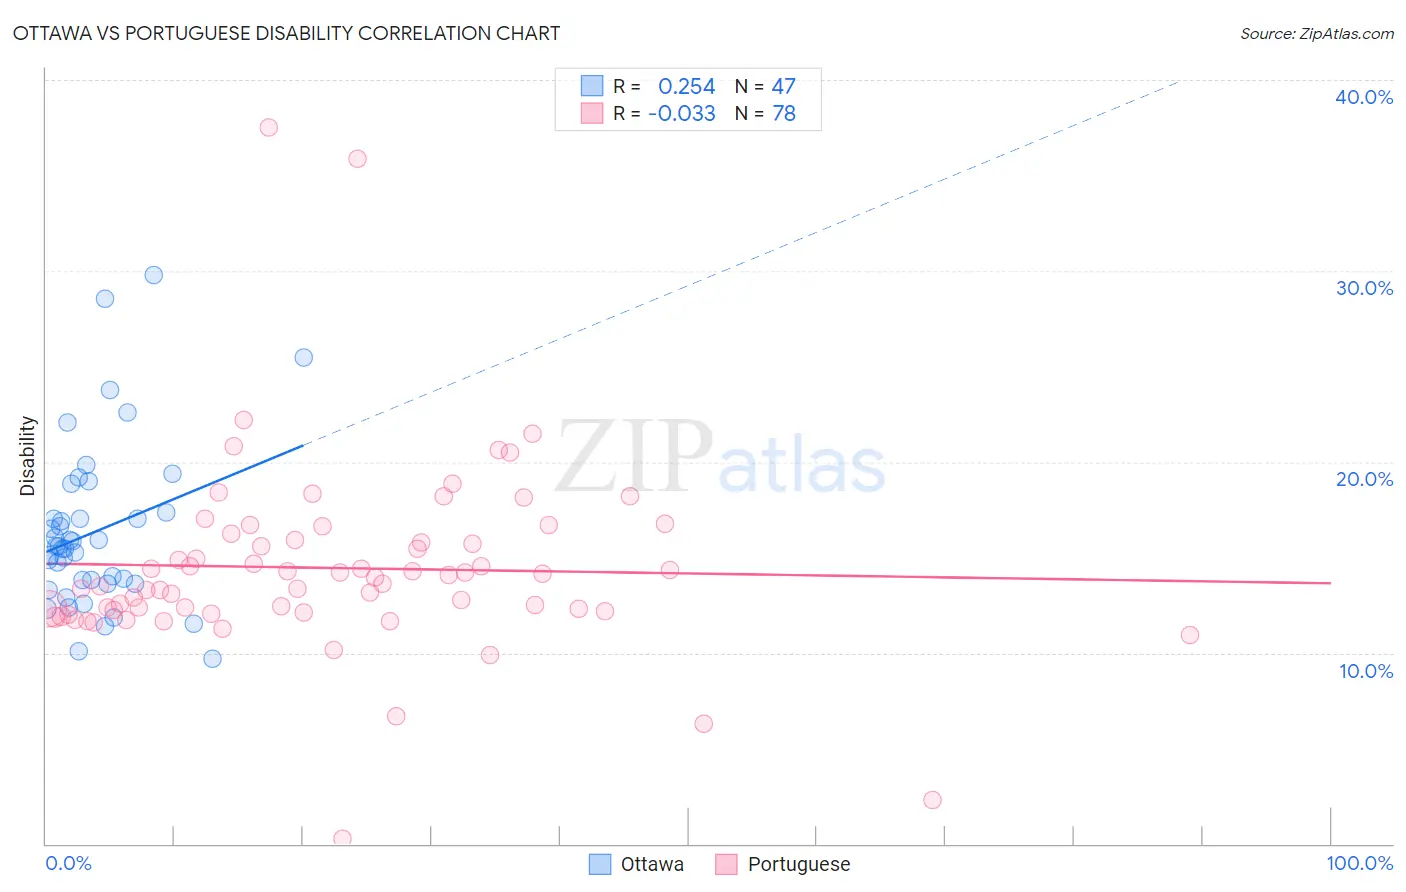
Ottawa vs Portuguese Disability Correlation Chart
The statistical analysis conducted on geographies consisting of 49,955,365 people shows a weak positive correlation between the proportion of Ottawa and percentage of population with a disability in the United States with a correlation coefficient (R) of 0.254 and weighted average of 14.2%. Similarly, the statistical analysis conducted on geographies consisting of 450,275,372 people shows no correlation between the proportion of Portuguese and percentage of population with a disability in the United States with a correlation coefficient (R) of -0.033 and weighted average of 12.6%, a difference of 12.2%.
Disability Correlation Summary
| Measurement | Ottawa | Portuguese |
| Minimum | 9.7% | 0.28% |
| Maximum | 29.8% | 37.5% |
| Range | 20.1% | 37.2% |
| Mean | 16.3% | 14.4% |
| Median | 15.6% | 13.8% |
| Interquartile 25% (IQ1) | 13.6% | 12.2% |
| Interquartile 75% (IQ3) | 17.3% | 15.9% |
| Interquartile Range (IQR) | 3.7% | 3.7% |
| Standard Deviation (Sample) | 4.3% | 5.1% |
| Standard Deviation (Population) | 4.3% | 5.1% |
Similar Demographics by Disability
Demographics Similar to Ottawa by Disability
In terms of disability, the demographic groups most similar to Ottawa are Immigrants from the Azores (14.2%, a difference of 0.0%), Osage (14.2%, a difference of 0.020%), Native/Alaskan (14.2%, a difference of 0.060%), Chippewa (14.1%, a difference of 0.10%), and Potawatomi (14.2%, a difference of 0.12%).
| Demographics | Rating | Rank | Disability |
| Apache | 0.0 /100 | #320 | Tragic 13.9% |
| Paiute | 0.0 /100 | #321 | Tragic 13.9% |
| Americans | 0.0 /100 | #322 | Tragic 13.9% |
| Comanche | 0.0 /100 | #323 | Tragic 14.1% |
| Chippewa | 0.0 /100 | #324 | Tragic 14.1% |
| Natives/Alaskans | 0.0 /100 | #325 | Tragic 14.2% |
| Osage | 0.0 /100 | #326 | Tragic 14.2% |
| Ottawa | 0.0 /100 | #327 | Tragic 14.2% |
| Immigrants | Azores | 0.0 /100 | #328 | Tragic 14.2% |
| Potawatomi | 0.0 /100 | #329 | Tragic 14.2% |
| Navajo | 0.0 /100 | #330 | Tragic 14.3% |
| Alaskan Athabascans | 0.0 /100 | #331 | Tragic 14.4% |
| Pueblo | 0.0 /100 | #332 | Tragic 14.4% |
| Cajuns | 0.0 /100 | #333 | Tragic 14.6% |
| Yuman | 0.0 /100 | #334 | Tragic 14.6% |
Demographics Similar to Portuguese by Disability
In terms of disability, the demographic groups most similar to Portuguese are Immigrants from Yemen (12.6%, a difference of 0.050%), Immigrants from Dominican Republic (12.6%, a difference of 0.39%), Bangladeshi (12.6%, a difference of 0.48%), Dominican (12.7%, a difference of 0.54%), and Finnish (12.7%, a difference of 0.70%).
| Demographics | Rating | Rank | Disability |
| Hawaiians | 0.2 /100 | #263 | Tragic 12.5% |
| Immigrants | Germany | 0.2 /100 | #264 | Tragic 12.5% |
| U.S. Virgin Islanders | 0.2 /100 | #265 | Tragic 12.5% |
| Czechoslovakians | 0.2 /100 | #266 | Tragic 12.5% |
| Spaniards | 0.2 /100 | #267 | Tragic 12.5% |
| Bangladeshis | 0.1 /100 | #268 | Tragic 12.6% |
| Immigrants | Dominican Republic | 0.1 /100 | #269 | Tragic 12.6% |
| Portuguese | 0.1 /100 | #270 | Tragic 12.6% |
| Immigrants | Yemen | 0.1 /100 | #271 | Tragic 12.6% |
| Dominicans | 0.0 /100 | #272 | Tragic 12.7% |
| Finns | 0.0 /100 | #273 | Tragic 12.7% |
| Nepalese | 0.0 /100 | #274 | Tragic 12.8% |
| Sioux | 0.0 /100 | #275 | Tragic 12.8% |
| Hmong | 0.0 /100 | #276 | Tragic 12.8% |
| Dutch | 0.0 /100 | #277 | Tragic 12.8% |