Osage vs British Ambulatory Disability
COMPARE
Osage
British
Ambulatory Disability
Ambulatory Disability Comparison
Osage
British
7.4%
AMBULATORY DISABILITY
0.0/ 100
METRIC RATING
322nd/ 347
METRIC RANK
6.2%
AMBULATORY DISABILITY
34.3/ 100
METRIC RATING
188th/ 347
METRIC RANK
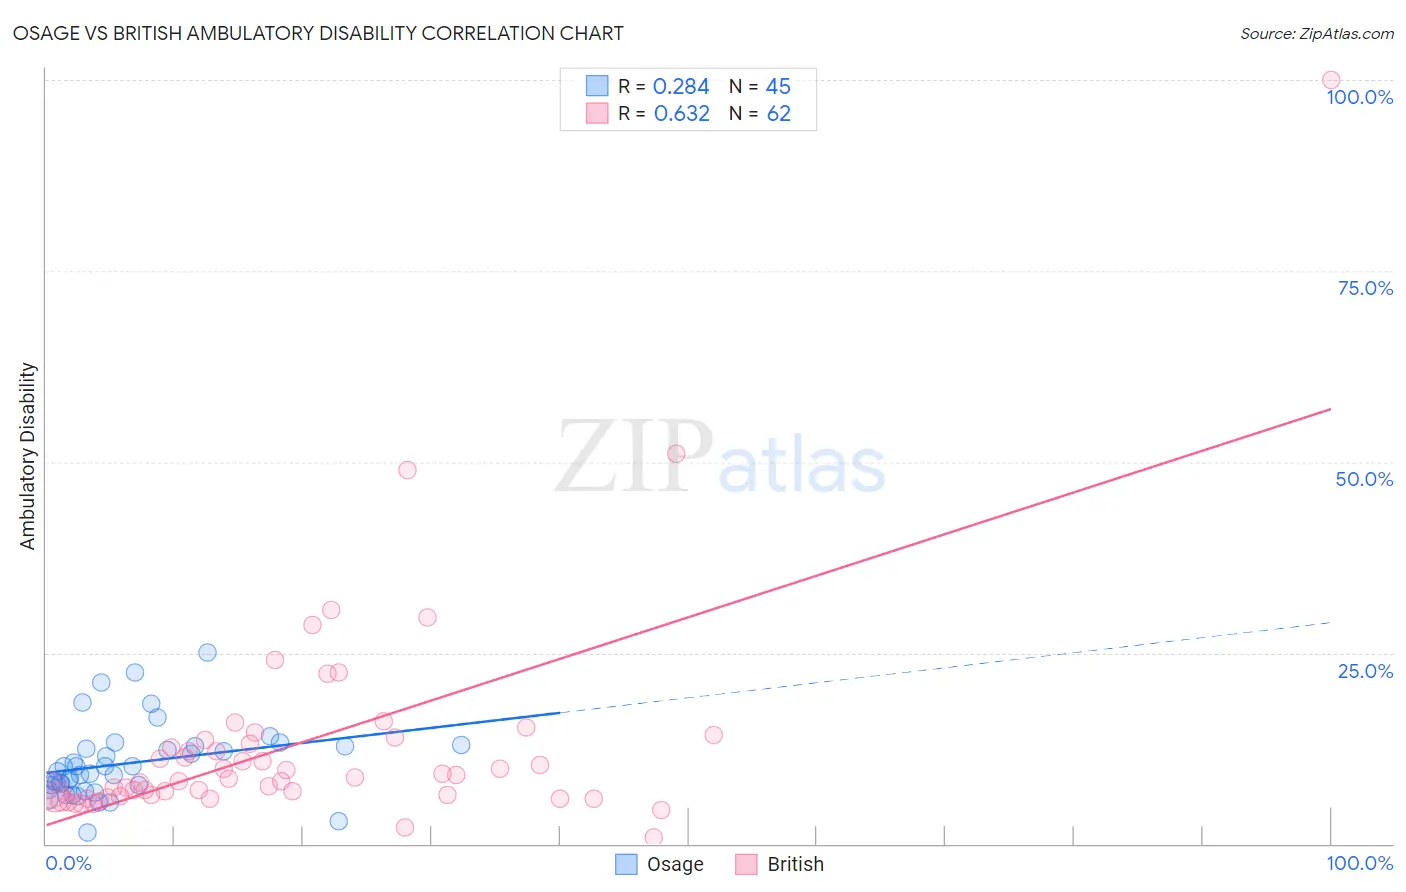
Osage vs British Ambulatory Disability Correlation Chart
The statistical analysis conducted on geographies consisting of 91,795,743 people shows a weak positive correlation between the proportion of Osage and percentage of population with ambulatory disability in the United States with a correlation coefficient (R) of 0.284 and weighted average of 7.4%. Similarly, the statistical analysis conducted on geographies consisting of 531,154,282 people shows a significant positive correlation between the proportion of British and percentage of population with ambulatory disability in the United States with a correlation coefficient (R) of 0.632 and weighted average of 6.2%, a difference of 19.7%.
Ambulatory Disability Correlation Summary
| Measurement | Osage | British |
| Minimum | 1.5% | 0.87% |
| Maximum | 25.0% | 100.0% |
| Range | 23.5% | 99.1% |
| Mean | 10.5% | 13.1% |
| Median | 9.5% | 8.6% |
| Interquartile 25% (IQ1) | 7.3% | 6.3% |
| Interquartile 75% (IQ3) | 12.8% | 13.6% |
| Interquartile Range (IQR) | 5.5% | 7.3% |
| Standard Deviation (Sample) | 4.9% | 14.6% |
| Standard Deviation (Population) | 4.8% | 14.5% |
Similar Demographics by Ambulatory Disability
Demographics Similar to Osage by Ambulatory Disability
In terms of ambulatory disability, the demographic groups most similar to Osage are Apache (7.4%, a difference of 0.14%), American (7.4%, a difference of 0.28%), Potawatomi (7.3%, a difference of 0.95%), Navajo (7.5%, a difference of 1.6%), and Comanche (7.5%, a difference of 1.7%).
| Demographics | Rating | Rank | Ambulatory Disability |
| Shoshone | 0.0 /100 | #315 | Tragic 7.1% |
| Immigrants | Dominican Republic | 0.0 /100 | #316 | Tragic 7.1% |
| Central American Indians | 0.0 /100 | #317 | Tragic 7.2% |
| Ottawa | 0.0 /100 | #318 | Tragic 7.2% |
| Dominicans | 0.0 /100 | #319 | Tragic 7.2% |
| Potawatomi | 0.0 /100 | #320 | Tragic 7.3% |
| Apache | 0.0 /100 | #321 | Tragic 7.4% |
| Osage | 0.0 /100 | #322 | Tragic 7.4% |
| Americans | 0.0 /100 | #323 | Tragic 7.4% |
| Navajo | 0.0 /100 | #324 | Tragic 7.5% |
| Comanche | 0.0 /100 | #325 | Tragic 7.5% |
| Blacks/African Americans | 0.0 /100 | #326 | Tragic 7.5% |
| Natives/Alaskans | 0.0 /100 | #327 | Tragic 7.5% |
| Hopi | 0.0 /100 | #328 | Tragic 7.6% |
| Pueblo | 0.0 /100 | #329 | Tragic 7.6% |
Demographics Similar to British by Ambulatory Disability
In terms of ambulatory disability, the demographic groups most similar to British are Ukrainian (6.2%, a difference of 0.020%), Immigrants from Western Africa (6.2%, a difference of 0.050%), Carpatho Rusyn (6.2%, a difference of 0.060%), European (6.2%, a difference of 0.11%), and Immigrants from Guatemala (6.2%, a difference of 0.14%).
| Demographics | Rating | Rank | Ambulatory Disability |
| Swiss | 43.1 /100 | #181 | Average 6.1% |
| Serbians | 42.8 /100 | #182 | Average 6.1% |
| Immigrants | Thailand | 42.2 /100 | #183 | Average 6.1% |
| Immigrants | Ghana | 41.2 /100 | #184 | Average 6.1% |
| Immigrants | Bosnia and Herzegovina | 37.2 /100 | #185 | Fair 6.2% |
| Europeans | 36.2 /100 | #186 | Fair 6.2% |
| Carpatho Rusyns | 35.3 /100 | #187 | Fair 6.2% |
| British | 34.3 /100 | #188 | Fair 6.2% |
| Ukrainians | 34.0 /100 | #189 | Fair 6.2% |
| Immigrants | Western Africa | 33.4 /100 | #190 | Fair 6.2% |
| Immigrants | Guatemala | 31.9 /100 | #191 | Fair 6.2% |
| Immigrants | Western Europe | 31.6 /100 | #192 | Fair 6.2% |
| Guatemalans | 30.0 /100 | #193 | Fair 6.2% |
| Alaska Natives | 29.8 /100 | #194 | Fair 6.2% |
| Belgians | 28.6 /100 | #195 | Fair 6.2% |