Nicaraguan vs Northern European Male Disability
COMPARE
Nicaraguan
Northern European
Male Disability
Male Disability Comparison
Nicaraguans
Northern Europeans
10.7%
MALE DISABILITY
96.6/ 100
METRIC RATING
96th/ 347
METRIC RANK
11.9%
MALE DISABILITY
1.1/ 100
METRIC RATING
242nd/ 347
METRIC RANK
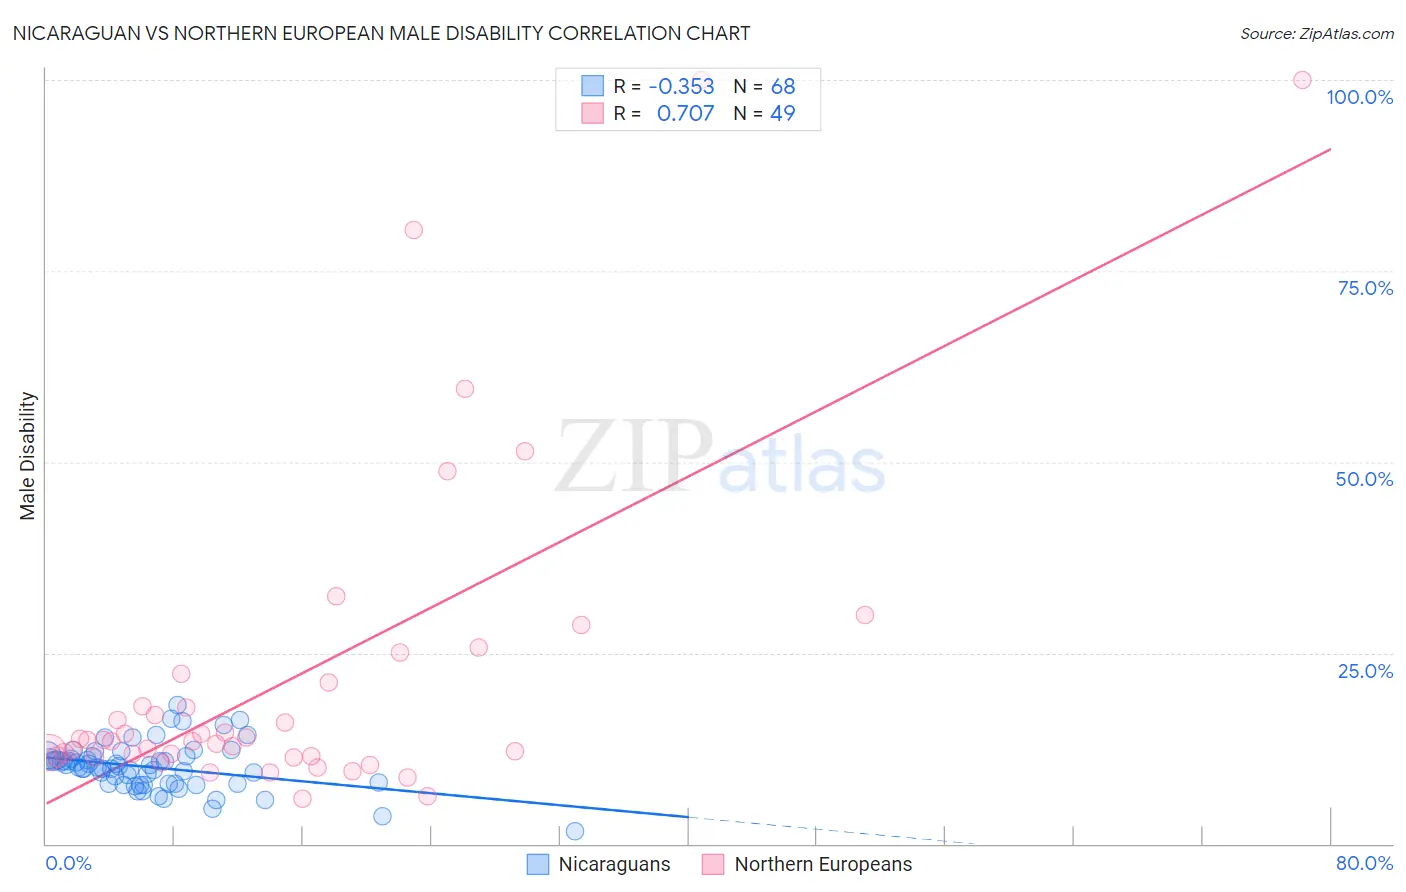
Nicaraguan vs Northern European Male Disability Correlation Chart
The statistical analysis conducted on geographies consisting of 285,689,446 people shows a mild negative correlation between the proportion of Nicaraguans and percentage of males with a disability in the United States with a correlation coefficient (R) of -0.353 and weighted average of 10.7%. Similarly, the statistical analysis conducted on geographies consisting of 406,040,370 people shows a strong positive correlation between the proportion of Northern Europeans and percentage of males with a disability in the United States with a correlation coefficient (R) of 0.707 and weighted average of 11.9%, a difference of 11.4%.
Male Disability Correlation Summary
| Measurement | Nicaraguan | Northern European |
| Minimum | 1.6% | 5.8% |
| Maximum | 18.1% | 100.0% |
| Range | 16.5% | 94.2% |
| Mean | 10.0% | 21.8% |
| Median | 10.1% | 13.6% |
| Interquartile 25% (IQ1) | 7.9% | 11.5% |
| Interquartile 75% (IQ3) | 11.3% | 21.7% |
| Interquartile Range (IQR) | 3.4% | 10.3% |
| Standard Deviation (Sample) | 3.0% | 21.6% |
| Standard Deviation (Population) | 3.0% | 21.4% |
Similar Demographics by Male Disability
Demographics Similar to Nicaraguans by Male Disability
In terms of male disability, the demographic groups most similar to Nicaraguans are Immigrants from Armenia (10.7%, a difference of 0.020%), Immigrants from Romania (10.7%, a difference of 0.080%), Chilean (10.7%, a difference of 0.10%), Immigrants from Sweden (10.7%, a difference of 0.13%), and Immigrants from Switzerland (10.7%, a difference of 0.22%).
| Demographics | Rating | Rank | Male Disability |
| Immigrants | Nicaragua | 97.8 /100 | #89 | Exceptional 10.6% |
| Immigrants | Morocco | 97.7 /100 | #90 | Exceptional 10.6% |
| Immigrants | France | 97.6 /100 | #91 | Exceptional 10.6% |
| Palestinians | 97.4 /100 | #92 | Exceptional 10.7% |
| Immigrants | St. Vincent and the Grenadines | 97.1 /100 | #93 | Exceptional 10.7% |
| Immigrants | Sweden | 96.9 /100 | #94 | Exceptional 10.7% |
| Chileans | 96.9 /100 | #95 | Exceptional 10.7% |
| Nicaraguans | 96.6 /100 | #96 | Exceptional 10.7% |
| Immigrants | Armenia | 96.6 /100 | #97 | Exceptional 10.7% |
| Immigrants | Romania | 96.5 /100 | #98 | Exceptional 10.7% |
| Immigrants | Switzerland | 96.1 /100 | #99 | Exceptional 10.7% |
| Immigrants | Kazakhstan | 95.9 /100 | #100 | Exceptional 10.7% |
| Immigrants | Greece | 95.6 /100 | #101 | Exceptional 10.7% |
| Immigrants | Eastern Europe | 95.3 /100 | #102 | Exceptional 10.7% |
| Uruguayans | 95.3 /100 | #103 | Exceptional 10.7% |
Demographics Similar to Northern Europeans by Male Disability
In terms of male disability, the demographic groups most similar to Northern Europeans are Bahamian (11.9%, a difference of 0.010%), Samoan (11.9%, a difference of 0.030%), Czech (11.9%, a difference of 0.050%), Italian (11.9%, a difference of 0.10%), and Immigrants from Laos (11.9%, a difference of 0.14%).
| Demographics | Rating | Rank | Male Disability |
| Immigrants | North America | 1.5 /100 | #235 | Tragic 11.9% |
| U.S. Virgin Islanders | 1.3 /100 | #236 | Tragic 11.9% |
| Carpatho Rusyns | 1.3 /100 | #237 | Tragic 11.9% |
| Yugoslavians | 1.2 /100 | #238 | Tragic 11.9% |
| Italians | 1.2 /100 | #239 | Tragic 11.9% |
| Czechs | 1.1 /100 | #240 | Tragic 11.9% |
| Bahamians | 1.1 /100 | #241 | Tragic 11.9% |
| Northern Europeans | 1.1 /100 | #242 | Tragic 11.9% |
| Samoans | 1.1 /100 | #243 | Tragic 11.9% |
| Immigrants | Laos | 1.0 /100 | #244 | Tragic 11.9% |
| Immigrants | Liberia | 1.0 /100 | #245 | Tragic 11.9% |
| Danes | 0.9 /100 | #246 | Tragic 11.9% |
| Hungarians | 0.8 /100 | #247 | Tragic 12.0% |
| Poles | 0.7 /100 | #248 | Tragic 12.0% |
| Immigrants | Yemen | 0.5 /100 | #249 | Tragic 12.0% |