Moroccan vs Immigrants from Moldova Ambulatory Disability
COMPARE
Moroccan
Immigrants from Moldova
Ambulatory Disability
Ambulatory Disability Comparison
Moroccans
Immigrants from Moldova
6.1%
AMBULATORY DISABILITY
52.6/ 100
METRIC RATING
171st/ 347
METRIC RANK
6.0%
AMBULATORY DISABILITY
82.4/ 100
METRIC RATING
147th/ 347
METRIC RANK
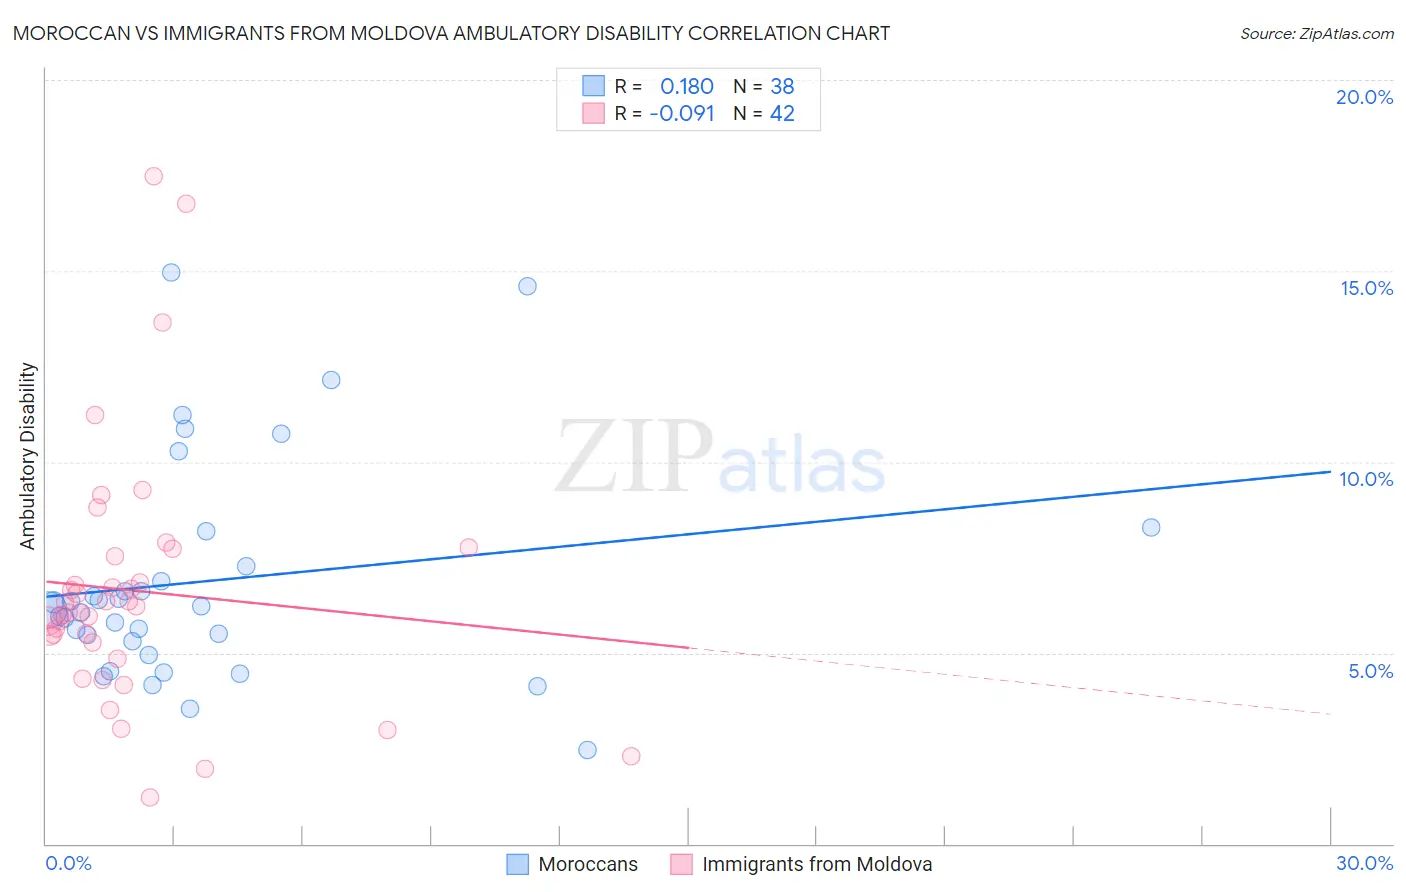
Moroccan vs Immigrants from Moldova Ambulatory Disability Correlation Chart
The statistical analysis conducted on geographies consisting of 201,789,132 people shows a poor positive correlation between the proportion of Moroccans and percentage of population with ambulatory disability in the United States with a correlation coefficient (R) of 0.180 and weighted average of 6.1%. Similarly, the statistical analysis conducted on geographies consisting of 124,381,325 people shows a slight negative correlation between the proportion of Immigrants from Moldova and percentage of population with ambulatory disability in the United States with a correlation coefficient (R) of -0.091 and weighted average of 6.0%, a difference of 1.9%.
Ambulatory Disability Correlation Summary
| Measurement | Moroccan | Immigrants from Moldova |
| Minimum | 2.5% | 1.2% |
| Maximum | 15.0% | 17.5% |
| Range | 12.5% | 16.3% |
| Mean | 6.9% | 6.6% |
| Median | 6.2% | 6.1% |
| Interquartile 25% (IQ1) | 5.3% | 5.3% |
| Interquartile 75% (IQ3) | 7.3% | 7.5% |
| Interquartile Range (IQR) | 2.0% | 2.2% |
| Standard Deviation (Sample) | 2.9% | 3.3% |
| Standard Deviation (Population) | 2.8% | 3.3% |
Similar Demographics by Ambulatory Disability
Demographics Similar to Moroccans by Ambulatory Disability
In terms of ambulatory disability, the demographic groups most similar to Moroccans are Immigrants from Burma/Myanmar (6.1%, a difference of 0.020%), Immigrants from Ecuador (6.1%, a difference of 0.070%), Croatian (6.1%, a difference of 0.080%), Immigrants from Canada (6.1%, a difference of 0.14%), and Immigrants from Southern Europe (6.1%, a difference of 0.29%).
| Demographics | Rating | Rank | Ambulatory Disability |
| Basques | 63.7 /100 | #164 | Good 6.1% |
| Nicaraguans | 63.2 /100 | #165 | Good 6.1% |
| Iraqis | 62.8 /100 | #166 | Good 6.1% |
| Immigrants | Oceania | 60.7 /100 | #167 | Good 6.1% |
| Ecuadorians | 60.5 /100 | #168 | Good 6.1% |
| Immigrants | Southern Europe | 58.1 /100 | #169 | Average 6.1% |
| Immigrants | Ecuador | 53.8 /100 | #170 | Average 6.1% |
| Moroccans | 52.6 /100 | #171 | Average 6.1% |
| Immigrants | Burma/Myanmar | 52.2 /100 | #172 | Average 6.1% |
| Croatians | 51.2 /100 | #173 | Average 6.1% |
| Immigrants | Canada | 50.0 /100 | #174 | Average 6.1% |
| Vietnamese | 47.2 /100 | #175 | Average 6.1% |
| Immigrants | North America | 45.6 /100 | #176 | Average 6.1% |
| Immigrants | England | 45.4 /100 | #177 | Average 6.1% |
| Scandinavians | 44.5 /100 | #178 | Average 6.1% |
Demographics Similar to Immigrants from Moldova by Ambulatory Disability
In terms of ambulatory disability, the demographic groups most similar to Immigrants from Moldova are Pakistani (6.0%, a difference of 0.010%), Immigrants from Greece (6.0%, a difference of 0.010%), Macedonian (6.0%, a difference of 0.040%), Immigrants from Eastern Europe (6.0%, a difference of 0.040%), and Romanian (6.0%, a difference of 0.050%).
| Demographics | Rating | Rank | Ambulatory Disability |
| Czechs | 83.3 /100 | #140 | Excellent 6.0% |
| Swedes | 83.1 /100 | #141 | Excellent 6.0% |
| Immigrants | Philippines | 83.0 /100 | #142 | Excellent 6.0% |
| Romanians | 82.9 /100 | #143 | Excellent 6.0% |
| Macedonians | 82.8 /100 | #144 | Excellent 6.0% |
| Pakistanis | 82.5 /100 | #145 | Excellent 6.0% |
| Immigrants | Greece | 82.5 /100 | #146 | Excellent 6.0% |
| Immigrants | Moldova | 82.4 /100 | #147 | Excellent 6.0% |
| Immigrants | Eastern Europe | 82.0 /100 | #148 | Excellent 6.0% |
| Lithuanians | 81.9 /100 | #149 | Excellent 6.0% |
| Maltese | 81.6 /100 | #150 | Excellent 6.0% |
| Greeks | 79.6 /100 | #151 | Good 6.0% |
| Immigrants | Austria | 78.8 /100 | #152 | Good 6.0% |
| Syrians | 75.5 /100 | #153 | Good 6.0% |
| Immigrants | Croatia | 75.1 /100 | #154 | Good 6.0% |