Macedonian vs Aleut Disability Age Over 75
COMPARE
Macedonian
Aleut
Disability Age Over 75
Disability Age Over 75 Comparison
Macedonians
Aleuts
45.4%
DISABILITY AGE OVER 75
99.9/ 100
METRIC RATING
26th/ 347
METRIC RANK
50.6%
DISABILITY AGE OVER 75
0.0/ 100
METRIC RATING
309th/ 347
METRIC RANK
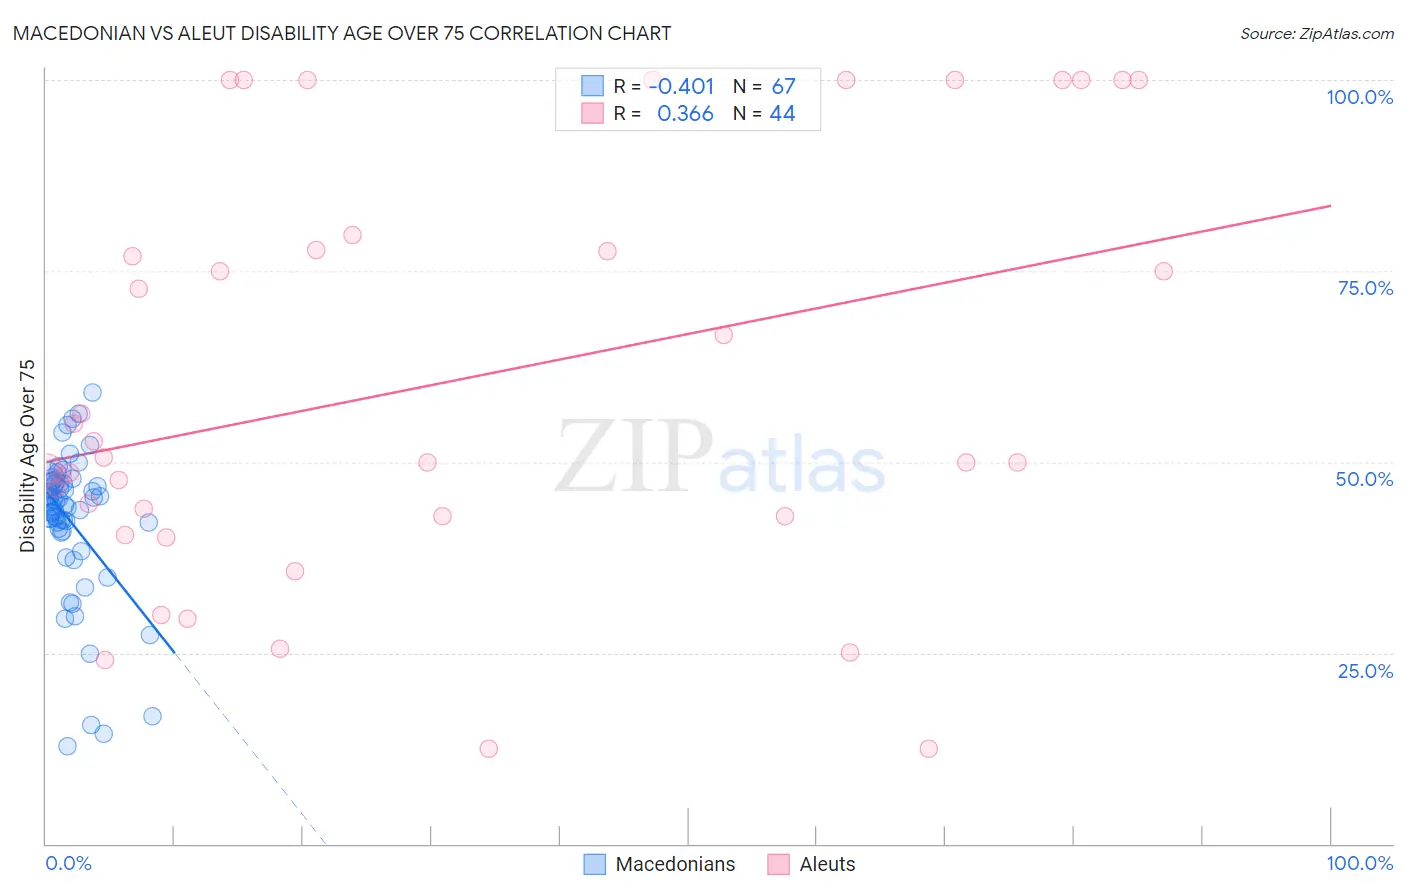
Macedonian vs Aleut Disability Age Over 75 Correlation Chart
The statistical analysis conducted on geographies consisting of 132,585,926 people shows a moderate negative correlation between the proportion of Macedonians and percentage of population with a disability over the age of 75 in the United States with a correlation coefficient (R) of -0.401 and weighted average of 45.4%. Similarly, the statistical analysis conducted on geographies consisting of 61,756,409 people shows a mild positive correlation between the proportion of Aleuts and percentage of population with a disability over the age of 75 in the United States with a correlation coefficient (R) of 0.366 and weighted average of 50.6%, a difference of 11.5%.
Disability Age Over 75 Correlation Summary
| Measurement | Macedonian | Aleut |
| Minimum | 12.8% | 12.5% |
| Maximum | 59.0% | 100.0% |
| Range | 46.2% | 87.5% |
| Mean | 42.2% | 60.3% |
| Median | 44.3% | 50.3% |
| Interquartile 25% (IQ1) | 40.9% | 42.9% |
| Interquartile 75% (IQ3) | 47.1% | 78.7% |
| Interquartile Range (IQR) | 6.2% | 35.9% |
| Standard Deviation (Sample) | 9.5% | 27.1% |
| Standard Deviation (Population) | 9.5% | 26.8% |
Similar Demographics by Disability Age Over 75
Demographics Similar to Macedonians by Disability Age Over 75
In terms of disability age over 75, the demographic groups most similar to Macedonians are Immigrants from Poland (45.4%, a difference of 0.010%), Immigrants from Bolivia (45.4%, a difference of 0.040%), Thai (45.4%, a difference of 0.040%), Polish (45.3%, a difference of 0.080%), and Filipino (45.4%, a difference of 0.080%).
| Demographics | Rating | Rank | Disability Age Over 75 |
| Immigrants | Greece | 100.0 /100 | #19 | Exceptional 45.2% |
| Immigrants | Serbia | 100.0 /100 | #20 | Exceptional 45.3% |
| Immigrants | Belgium | 100.0 /100 | #21 | Exceptional 45.3% |
| Immigrants | South Africa | 100.0 /100 | #22 | Exceptional 45.3% |
| Immigrants | Switzerland | 99.9 /100 | #23 | Exceptional 45.3% |
| Poles | 99.9 /100 | #24 | Exceptional 45.3% |
| Immigrants | Bolivia | 99.9 /100 | #25 | Exceptional 45.4% |
| Macedonians | 99.9 /100 | #26 | Exceptional 45.4% |
| Immigrants | Poland | 99.9 /100 | #27 | Exceptional 45.4% |
| Thais | 99.9 /100 | #28 | Exceptional 45.4% |
| Filipinos | 99.9 /100 | #29 | Exceptional 45.4% |
| Immigrants | Denmark | 99.9 /100 | #30 | Exceptional 45.4% |
| Immigrants | Bulgaria | 99.9 /100 | #31 | Exceptional 45.5% |
| Immigrants | Australia | 99.9 /100 | #32 | Exceptional 45.5% |
| Immigrants | Croatia | 99.9 /100 | #33 | Exceptional 45.5% |
Demographics Similar to Aleuts by Disability Age Over 75
In terms of disability age over 75, the demographic groups most similar to Aleuts are Hispanic or Latino (50.6%, a difference of 0.0%), Immigrants from Fiji (50.6%, a difference of 0.030%), Tlingit-Haida (50.6%, a difference of 0.040%), Immigrants from Central America (50.5%, a difference of 0.080%), and Cajun (50.7%, a difference of 0.14%).
| Demographics | Rating | Rank | Disability Age Over 75 |
| Cherokee | 0.0 /100 | #302 | Tragic 50.2% |
| Japanese | 0.0 /100 | #303 | Tragic 50.2% |
| Immigrants | Dominican Republic | 0.0 /100 | #304 | Tragic 50.3% |
| Central American Indians | 0.0 /100 | #305 | Tragic 50.5% |
| Immigrants | Central America | 0.0 /100 | #306 | Tragic 50.5% |
| Immigrants | Fiji | 0.0 /100 | #307 | Tragic 50.6% |
| Hispanics or Latinos | 0.0 /100 | #308 | Tragic 50.6% |
| Aleuts | 0.0 /100 | #309 | Tragic 50.6% |
| Tlingit-Haida | 0.0 /100 | #310 | Tragic 50.6% |
| Cajuns | 0.0 /100 | #311 | Tragic 50.7% |
| Cheyenne | 0.0 /100 | #312 | Tragic 50.9% |
| Immigrants | Azores | 0.0 /100 | #313 | Tragic 50.9% |
| Immigrants | Mexico | 0.0 /100 | #314 | Tragic 51.1% |
| Mexicans | 0.0 /100 | #315 | Tragic 51.1% |
| Chickasaw | 0.0 /100 | #316 | Tragic 51.2% |