Luxembourger vs Immigrants from Serbia Female Disability

COMPARE

Luxembourger
Race
Ancestry
AfghanAfricanAlaska NativeAlaskan AthabascanAlbanianAleutAlsatianAmericanApacheArabArapahoArgentineanArmenianAssyrian/Chaldean/SyriacAustralianAustrianBahamianBangladeshiBarbadianBasqueBelgianBelizeanBermudanBhutaneseBlackfeetBolivianBrazilianBritishBritish West IndianBulgarianBurmeseCajunCambodianCanadianCape VerdeanCarpatho RusynCelticCentral AmericanCentral American IndianCherokeeCheyenneChickasawChileanChineseChippewaChoctawColombianColvilleComancheCosta RicanCreeCreekCroatianCrowCubanCypriotCzechCzechoslovakianDanishDelawareDominicanDutchDutch West IndianEastern EuropeanEcuadorianEgyptianEnglishEstonianEthiopianEuropeanFijianFilipinoFinnishFrenchFrench American IndianFrench CanadianGermanGerman RussianGhanaianGreekGuamanian/ChamorroGuatemalanGuyaneseHaitianHmongHonduranHopiHoumaHungarianIcelanderIndian (Asian)IndonesianInupiatIranianIraqiIrishIroquoisIsraeliItalianJamaicanJapaneseJordanianKenyanKiowaKoreanLaotianLatvianLebaneseLiberianLithuanianLumbeeLuxembourgerMacedonianMalaysianMalteseMarshalleseMenomineeMexicanMexican American IndianMongolianMoroccanNative HawaiianNavajoNepaleseNew ZealanderNicaraguanNigerianNorthern EuropeanNorwegianOkinawanOsageOttawaPaiutePakistaniPalestinianPanamanianParaguayanPennsylvania GermanPeruvianPimaPolishPortuguesePotawatomiPuebloPuerto RicanPuget Sound SalishRomanianRussianSalvadoranSamoanScandinavianScotch-IrishScottishSeminoleSenegaleseSerbianShoshoneSierra LeoneanSiouxSlavicSlovakSloveneSomaliSouth AfricanSouth AmericanSouth American IndianSoviet UnionSpaniardSpanishSpanish AmericanSpanish American IndianSri LankanSubsaharan AfricanSudaneseSwedishSwissSyrianTaiwaneseThaiTlingit-HaidaTohono O'OdhamTonganTrinidadian and TobagonianTsimshianTurkishU.S. Virgin IslanderUgandanUkrainianUruguayanUteVenezuelanVietnameseWelshWest IndianYakamaYaquiYugoslavianYumanYup'ikZimbabwean
Immigration
NonimmigrantsImmigrantsAfghanistanAfricaAlbaniaArgentinaArmeniaAsiaAustraliaAustriaBahamasBangladeshBarbadosBelarusBelgiumBelizeBoliviaBosnia and HerzegovinaBrazilBulgariaBurma/MyanmarCabo VerdeCambodiaCameroonCanadaCaribbeanCentral AmericaChileChinaColombiaCongoCosta RicaCroatiaCubaCzechoslovakiaDenmarkDominicaDominican RepublicEastern AfricaEastern AsiaEastern EuropeEcuadorEgyptEl SalvadorEnglandEritreaEthiopiaEuropeFijiFranceGermanyGhanaGreeceGrenadaGuatemalaGuyanaHaitiHondurasHong KongHungaryIndiaIndonesiaIranIraqIrelandIsraelItalyJamaicaJapanJordanKazakhstanKenyaKoreaKuwaitLaosLatin AmericaLatviaLebanonLiberiaLithuaniaMalaysiaMexicoMicronesiaMiddle AfricaMoldovaMoroccoNepalNetherlandsNicaraguaNigeriaNorth AmericaNorth MacedoniaNorthern AfricaNorthern EuropeNorwayOceaniaPakistanPanamaPeruPhilippinesPolandPortugalRomaniaRussiaSaudi ArabiaScotlandSenegalSierra LeoneSingaporeSomaliaSouth AfricaSouth AmericaSouth Central AsiaSouth Eastern AsiaSouthern EuropeSpainSri LankaSt. Vincent and the GrenadinesSudanSwedenSwitzerlandSyriaTaiwanThailandTrinidad and TobagoTurkeyUgandaUkraineUruguayUzbekistanVenezuelaVietnamWest IndiesWestern AfricaWestern AsiaWestern EuropeYemenZaireZimbabweAzores
Immigrants from Serbia
Race
Ancestry
AfghanAfricanAlaska NativeAlaskan AthabascanAlbanianAleutAlsatianAmericanApacheArabArapahoArgentineanArmenianAssyrian/Chaldean/SyriacAustralianAustrianBahamianBangladeshiBarbadianBasqueBelgianBelizeanBermudanBhutaneseBlackfeetBolivianBrazilianBritishBritish West IndianBulgarianBurmeseCajunCambodianCanadianCape VerdeanCarpatho RusynCelticCentral AmericanCentral American IndianCherokeeCheyenneChickasawChileanChineseChippewaChoctawColombianColvilleComancheCosta RicanCreeCreekCroatianCrowCubanCypriotCzechCzechoslovakianDanishDelawareDominicanDutchDutch West IndianEastern EuropeanEcuadorianEgyptianEnglishEstonianEthiopianEuropeanFijianFilipinoFinnishFrenchFrench American IndianFrench CanadianGermanGerman RussianGhanaianGreekGuamanian/ChamorroGuatemalanGuyaneseHaitianHmongHonduranHopiHoumaHungarianIcelanderIndian (Asian)IndonesianInupiatIranianIraqiIrishIroquoisIsraeliItalianJamaicanJapaneseJordanianKenyanKiowaKoreanLaotianLatvianLebaneseLiberianLithuanianLumbeeMacedonianMalaysianMalteseMarshalleseMenomineeMexicanMexican American IndianMongolianMoroccanNative HawaiianNavajoNepaleseNew ZealanderNicaraguanNigerianNorthern EuropeanNorwegianOkinawanOsageOttawaPaiutePakistaniPalestinianPanamanianParaguayanPennsylvania GermanPeruvianPimaPolishPortuguesePotawatomiPuebloPuerto RicanPuget Sound SalishRomanianRussianSalvadoranSamoanScandinavianScotch-IrishScottishSeminoleSenegaleseSerbianShoshoneSierra LeoneanSiouxSlavicSlovakSloveneSomaliSouth AfricanSouth AmericanSouth American IndianSoviet UnionSpaniardSpanishSpanish AmericanSpanish American IndianSri LankanSubsaharan AfricanSudaneseSwedishSwissSyrianTaiwaneseThaiTlingit-HaidaTohono O'OdhamTonganTrinidadian and TobagonianTsimshianTurkishU.S. Virgin IslanderUgandanUkrainianUruguayanUteVenezuelanVietnameseWelshWest IndianYakamaYaquiYugoslavianYumanYup'ikZimbabwean
Immigration
NonimmigrantsImmigrantsAfghanistanAfricaAlbaniaArgentinaArmeniaAsiaAustraliaAustriaBahamasBangladeshBarbadosBelarusBelgiumBelizeBoliviaBosnia and HerzegovinaBrazilBulgariaBurma/MyanmarCabo VerdeCambodiaCameroonCanadaCaribbeanCentral AmericaChileChinaColombiaCongoCosta RicaCroatiaCubaCzechoslovakiaDenmarkDominicaDominican RepublicEastern AfricaEastern AsiaEastern EuropeEcuadorEgyptEl SalvadorEnglandEritreaEthiopiaEuropeFijiFranceGermanyGhanaGreeceGrenadaGuatemalaGuyanaHaitiHondurasHong KongHungaryIndiaIndonesiaIranIraqIrelandIsraelItalyJamaicaJapanJordanKazakhstanKenyaKoreaKuwaitLaosLatin AmericaLatviaLebanonLiberiaLithuaniaMalaysiaMexicoMicronesiaMiddle AfricaMoldovaMoroccoNepalNetherlandsNicaraguaNigeriaNorth AmericaNorth MacedoniaNorthern AfricaNorthern EuropeNorwayOceaniaPakistanPanamaPeruPhilippinesPolandPortugalRomaniaRussiaSaudi ArabiaScotlandSenegalSerbiaSierra LeoneSingaporeSomaliaSouth AfricaSouth AmericaSouth Central AsiaSouth Eastern AsiaSouthern EuropeSpainSri LankaSt. Vincent and the GrenadinesSudanSwedenSwitzerlandSyriaTaiwanThailandTrinidad and TobagoTurkeyUgandaUkraineUruguayUzbekistanVenezuelaVietnamWest IndiesWestern AfricaWestern AsiaWestern EuropeYemenZaireZimbabweAzores
Female Disability
Income
Poverty
Unemployment
Labor Participation
Family Structure
Vehicle Availability
Education Level
Disability

Female Disability Comparison

Luxembourgers

Immigrants from Serbia

Exceptional
Exceptional
11.6%
FEMALE DISABILITY
99.6/ 100
METRIC RATING
82nd/ 347
METRIC RANK
11.6%
FEMALE DISABILITY
99.6/ 100
METRIC RATING
83rd/ 347
METRIC RANK

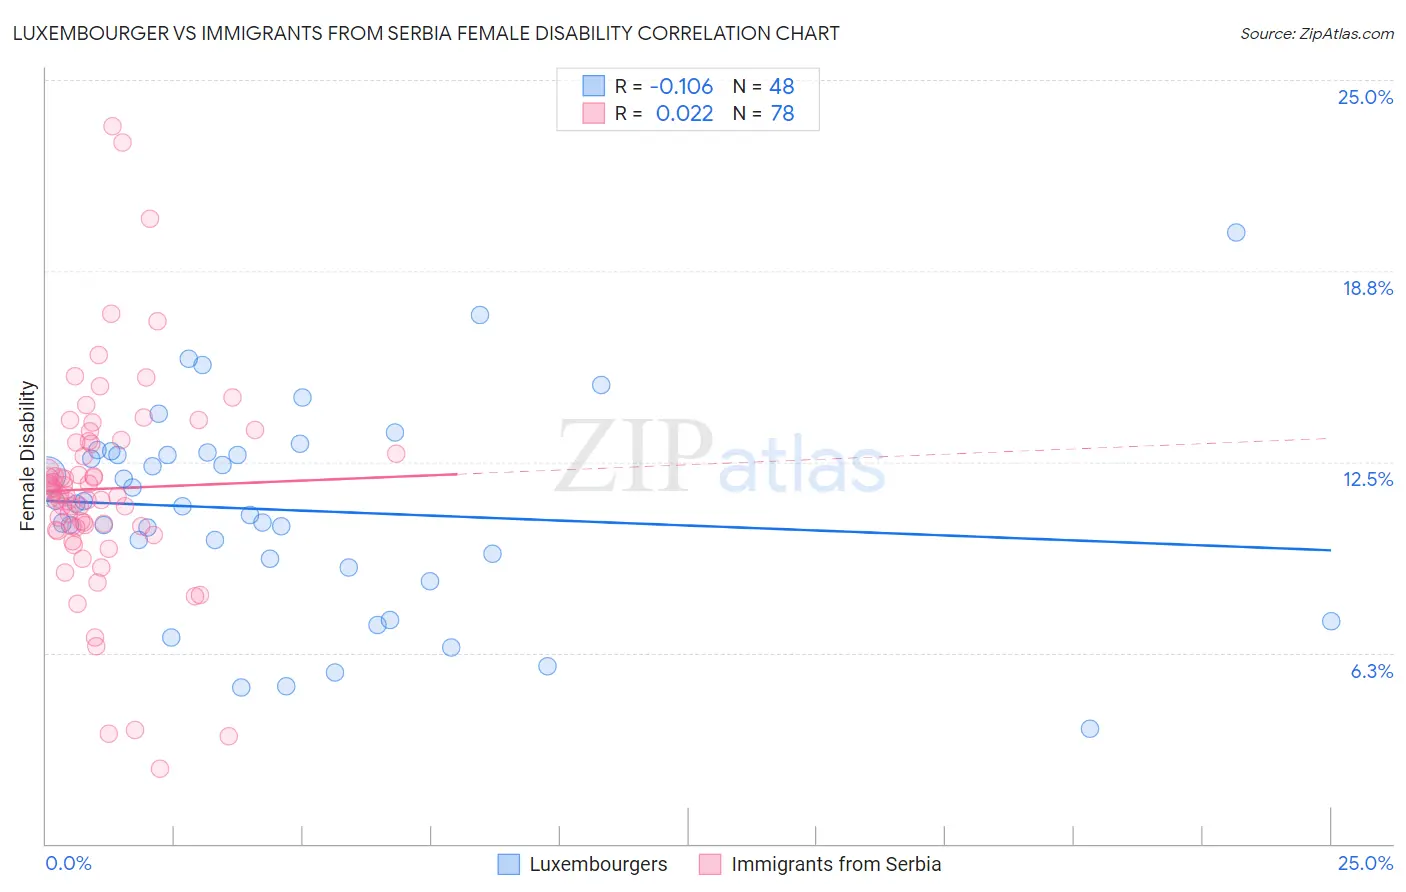
Luxembourger vs Immigrants from Serbia Female Disability Correlation Chart

The statistical analysis conducted on geographies consisting of 144,677,023 people shows a poor negative correlation between the proportion of Luxembourgers and percentage of females with a disability in the United States with a correlation coefficient (R) of -0.106 and weighted average of 11.6%. Similarly, the statistical analysis conducted on geographies consisting of 131,740,761 people shows no correlation between the proportion of Immigrants from Serbia and percentage of females with a disability in the United States with a correlation coefficient (R) of 0.022 and weighted average of 11.6%, a difference of 0.020%.
Luxembourger vs Immigrants from Serbia Female Disability

Female Disability Correlation Summary

MeasurementLuxembourgerImmigrants from Serbia
Minimum3.8%2.5%
Maximum20.0%23.5%
Range16.2%21.0%
Mean10.9%11.6%
Median11.1%11.4%
Interquartile 25% (IQ1)9.2%10.4%
Interquartile 75% (IQ3)12.8%13.1%
Interquartile Range (IQR)3.6%2.8%
Standard Deviation (Sample)3.3%3.5%
Standard Deviation (Population)3.3%3.5%

Demographics Similar to Luxembourgers and Immigrants from Serbia by Female Disability

In terms of female disability, the demographic groups most similar to Luxembourgers are Immigrants from Poland (11.6%, a difference of 0.050%), Palestinian (11.6%, a difference of 0.080%), Immigrants from Cameroon (11.6%, a difference of 0.080%), Immigrants from Denmark (11.6%, a difference of 0.15%), and Yup'ik (11.6%, a difference of 0.15%). Similarly, the demographic groups most similar to Immigrants from Serbia are Immigrants from Poland (11.6%, a difference of 0.030%), Palestinian (11.6%, a difference of 0.060%), Immigrants from Cameroon (11.6%, a difference of 0.070%), Immigrants from Denmark (11.6%, a difference of 0.13%), and Yup'ik (11.6%, a difference of 0.13%).
DemographicsRating | RankFemale Disability
Chileans
99.8
/100
|
#72
Exceptional
11.5%
Immigrants | Switzerland
99.8
/100
|
#73
Exceptional
11.5%
Bhutanese
99.8
/100
|
#74
Exceptional
11.5%
Immigrants | Lebanon
99.7
/100
|
#75
Exceptional
11.5%
Immigrants | Eritrea
99.7
/100
|
#76
Exceptional
11.5%
Immigrants | Afghanistan
99.7
/100
|
#77
Exceptional
11.5%
Immigrants | South Africa
99.7
/100
|
#78
Exceptional
11.5%
Sierra Leoneans
99.7
/100
|
#79
Exceptional
11.5%
Immigrants | Jordan
99.7
/100
|
#80
Exceptional
11.5%
Eastern Europeans
99.7
/100
|
#81
Exceptional
11.5%
Luxembourgers
99.6
/100
|
#82
Exceptional
11.6%
Immigrants | Serbia
99.6
/100
|
#83
Exceptional
11.6%
Immigrants | Poland
99.6
/100
|
#84
Exceptional
11.6%
Palestinians
99.6
/100
|
#85
Exceptional
11.6%
Immigrants | Cameroon
99.6
/100
|
#86
Exceptional
11.6%
Immigrants | Denmark
99.5
/100
|
#87
Exceptional
11.6%
Yup'ik
99.5
/100
|
#88
Exceptional
11.6%
Vietnamese
99.5
/100
|
#89
Exceptional
11.6%
Immigrants | Romania
99.5
/100
|
#90
Exceptional
11.6%
Immigrants | Zimbabwe
99.5
/100
|
#91
Exceptional
11.6%
Immigrants | Czechoslovakia
99.5
/100
|
#92
Exceptional
11.6%