Latvian vs Mongolian Disability Age 35 to 64
COMPARE
Latvian
Mongolian
Disability Age 35 to 64
Disability Age 35 to 64 Comparison
Latvians
Mongolians
10.2%
DISABILITY AGE 35 TO 64
99.2/ 100
METRIC RATING
81st/ 347
METRIC RANK
10.1%
DISABILITY AGE 35 TO 64
99.4/ 100
METRIC RATING
77th/ 347
METRIC RANK
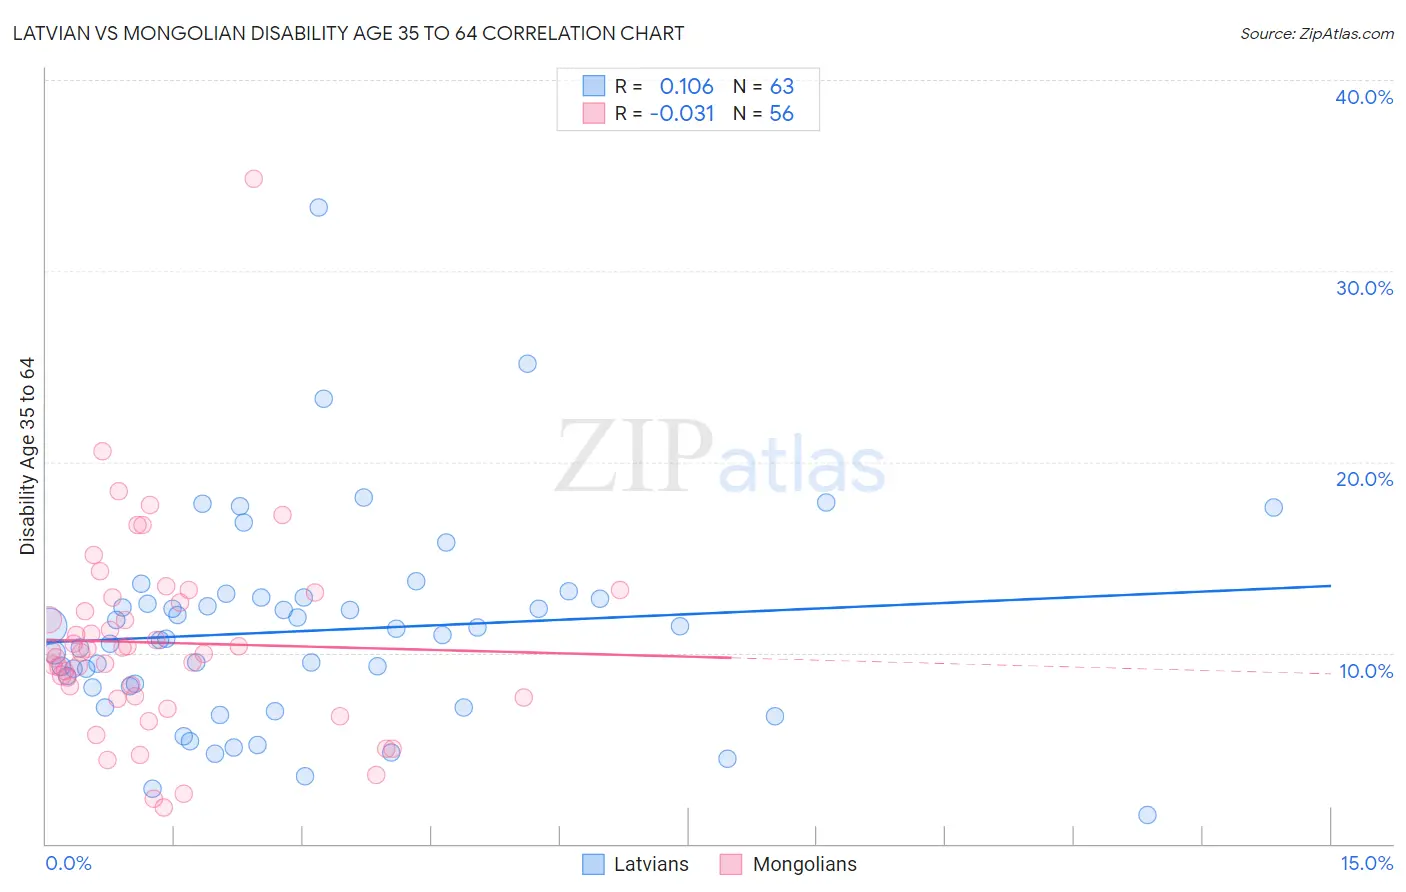
Latvian vs Mongolian Disability Age 35 to 64 Correlation Chart
The statistical analysis conducted on geographies consisting of 220,634,735 people shows a poor positive correlation between the proportion of Latvians and percentage of population with a disability between the ages 34 and 64 in the United States with a correlation coefficient (R) of 0.106 and weighted average of 10.2%. Similarly, the statistical analysis conducted on geographies consisting of 140,298,014 people shows no correlation between the proportion of Mongolians and percentage of population with a disability between the ages 34 and 64 in the United States with a correlation coefficient (R) of -0.031 and weighted average of 10.1%, a difference of 0.44%.
Disability Age 35 to 64 Correlation Summary
| Measurement | Latvian | Mongolian |
| Minimum | 1.5% | 1.9% |
| Maximum | 33.4% | 34.8% |
| Range | 31.8% | 32.9% |
| Mean | 11.2% | 10.5% |
| Median | 10.9% | 10.1% |
| Interquartile 25% (IQ1) | 8.2% | 7.7% |
| Interquartile 75% (IQ3) | 12.9% | 12.8% |
| Interquartile Range (IQR) | 4.7% | 5.1% |
| Standard Deviation (Sample) | 5.4% | 5.2% |
| Standard Deviation (Population) | 5.3% | 5.2% |
Demographics Similar to Latvians and Mongolians by Disability Age 35 to 64
In terms of disability age 35 to 64, the demographic groups most similar to Latvians are Russian (10.2%, a difference of 0.060%), Immigrants from Brazil (10.2%, a difference of 0.070%), Immigrants from Croatia (10.2%, a difference of 0.10%), Sri Lankan (10.2%, a difference of 0.13%), and Immigrants from Vietnam (10.1%, a difference of 0.23%). Similarly, the demographic groups most similar to Mongolians are Immigrants from Chile (10.1%, a difference of 0.030%), Immigrants from Latvia (10.1%, a difference of 0.040%), Laotian (10.1%, a difference of 0.14%), Jordanian (10.1%, a difference of 0.14%), and Immigrants from Vietnam (10.1%, a difference of 0.21%).
| Demographics | Rating | Rank | Disability Age 35 to 64 |
| Immigrants | Eastern Europe | 99.5 /100 | #69 | Exceptional 10.1% |
| Immigrants | Nicaragua | 99.5 /100 | #70 | Exceptional 10.1% |
| Immigrants | Kazakhstan | 99.5 /100 | #71 | Exceptional 10.1% |
| Immigrants | Northern Europe | 99.5 /100 | #72 | Exceptional 10.1% |
| Immigrants | France | 99.5 /100 | #73 | Exceptional 10.1% |
| Laotians | 99.4 /100 | #74 | Exceptional 10.1% |
| Immigrants | Latvia | 99.4 /100 | #75 | Exceptional 10.1% |
| Immigrants | Chile | 99.4 /100 | #76 | Exceptional 10.1% |
| Mongolians | 99.4 /100 | #77 | Exceptional 10.1% |
| Jordanians | 99.3 /100 | #78 | Exceptional 10.1% |
| Immigrants | Vietnam | 99.3 /100 | #79 | Exceptional 10.1% |
| Immigrants | Croatia | 99.3 /100 | #80 | Exceptional 10.2% |
| Latvians | 99.2 /100 | #81 | Exceptional 10.2% |
| Russians | 99.2 /100 | #82 | Exceptional 10.2% |
| Immigrants | Brazil | 99.2 /100 | #83 | Exceptional 10.2% |
| Sri Lankans | 99.2 /100 | #84 | Exceptional 10.2% |
| Immigrants | Kuwait | 99.1 /100 | #85 | Exceptional 10.2% |
| Immigrants | Europe | 99.1 /100 | #86 | Exceptional 10.2% |
| Nicaraguans | 99.1 /100 | #87 | Exceptional 10.2% |
| Chileans | 99.0 /100 | #88 | Exceptional 10.2% |
| Uruguayans | 99.0 /100 | #89 | Exceptional 10.2% |