Kiowa vs Latvian Disability Age Over 75
COMPARE
Kiowa
Latvian
Disability Age Over 75
Disability Age Over 75 Comparison
Kiowa
Latvians
54.2%
DISABILITY AGE OVER 75
0.0/ 100
METRIC RATING
335th/ 347
METRIC RANK
45.1%
DISABILITY AGE OVER 75
100.0/ 100
METRIC RATING
13th/ 347
METRIC RANK
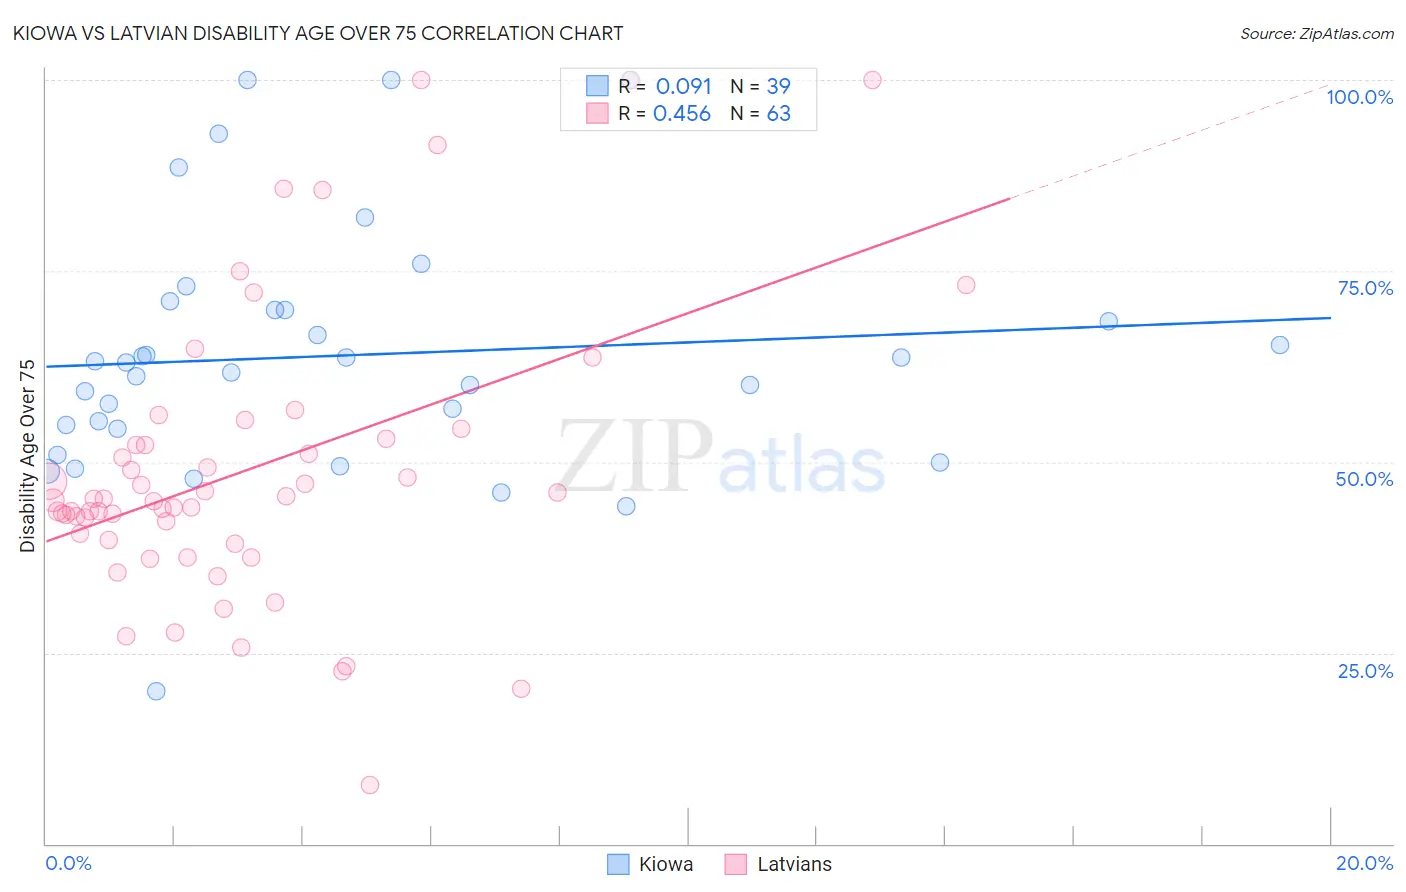
Kiowa vs Latvian Disability Age Over 75 Correlation Chart
The statistical analysis conducted on geographies consisting of 56,070,567 people shows a slight positive correlation between the proportion of Kiowa and percentage of population with a disability over the age of 75 in the United States with a correlation coefficient (R) of 0.091 and weighted average of 54.2%. Similarly, the statistical analysis conducted on geographies consisting of 220,463,619 people shows a moderate positive correlation between the proportion of Latvians and percentage of population with a disability over the age of 75 in the United States with a correlation coefficient (R) of 0.456 and weighted average of 45.1%, a difference of 20.2%.
Disability Age Over 75 Correlation Summary
| Measurement | Kiowa | Latvian |
| Minimum | 20.0% | 7.7% |
| Maximum | 100.0% | 100.0% |
| Range | 80.0% | 92.3% |
| Mean | 63.9% | 48.9% |
| Median | 63.0% | 44.9% |
| Interquartile 25% (IQ1) | 54.3% | 39.7% |
| Interquartile 75% (IQ3) | 69.9% | 53.1% |
| Interquartile Range (IQR) | 15.6% | 13.3% |
| Standard Deviation (Sample) | 16.5% | 19.0% |
| Standard Deviation (Population) | 16.3% | 18.8% |
Similar Demographics by Disability Age Over 75
Demographics Similar to Kiowa by Disability Age Over 75
In terms of disability age over 75, the demographic groups most similar to Kiowa are Immigrants from Armenia (54.3%, a difference of 0.17%), Yuman (54.4%, a difference of 0.33%), Alaskan Athabascan (54.0%, a difference of 0.53%), Apache (53.6%, a difference of 1.2%), and Colville (55.4%, a difference of 2.1%).
| Demographics | Rating | Rank | Disability Age Over 75 |
| Choctaw | 0.0 /100 | #328 | Tragic 52.7% |
| Alaska Natives | 0.0 /100 | #329 | Tragic 52.8% |
| Puerto Ricans | 0.0 /100 | #330 | Tragic 52.9% |
| Hopi | 0.0 /100 | #331 | Tragic 52.9% |
| Natives/Alaskans | 0.0 /100 | #332 | Tragic 53.1% |
| Apache | 0.0 /100 | #333 | Tragic 53.6% |
| Alaskan Athabascans | 0.0 /100 | #334 | Tragic 54.0% |
| Kiowa | 0.0 /100 | #335 | Tragic 54.2% |
| Immigrants | Armenia | 0.0 /100 | #336 | Tragic 54.3% |
| Yuman | 0.0 /100 | #337 | Tragic 54.4% |
| Colville | 0.0 /100 | #338 | Tragic 55.4% |
| Pima | 0.0 /100 | #339 | Tragic 55.8% |
| Pueblo | 0.0 /100 | #340 | Tragic 55.9% |
| Houma | 0.0 /100 | #341 | Tragic 56.2% |
| Lumbee | 0.0 /100 | #342 | Tragic 56.2% |
Demographics Similar to Latvians by Disability Age Over 75
In terms of disability age over 75, the demographic groups most similar to Latvians are Immigrants from Czechoslovakia (45.1%, a difference of 0.010%), Immigrants from Scotland (45.1%, a difference of 0.010%), Immigrants from Sweden (45.1%, a difference of 0.050%), Lithuanian (45.1%, a difference of 0.10%), and Bulgarian (45.1%, a difference of 0.15%).
| Demographics | Rating | Rank | Disability Age Over 75 |
| Immigrants | Lithuania | 100.0 /100 | #6 | Exceptional 44.9% |
| Okinawans | 100.0 /100 | #7 | Exceptional 44.9% |
| Immigrants | Austria | 100.0 /100 | #8 | Exceptional 44.9% |
| Paraguayans | 100.0 /100 | #9 | Exceptional 45.0% |
| Bulgarians | 100.0 /100 | #10 | Exceptional 45.1% |
| Lithuanians | 100.0 /100 | #11 | Exceptional 45.1% |
| Immigrants | Czechoslovakia | 100.0 /100 | #12 | Exceptional 45.1% |
| Latvians | 100.0 /100 | #13 | Exceptional 45.1% |
| Immigrants | Scotland | 100.0 /100 | #14 | Exceptional 45.1% |
| Immigrants | Sweden | 100.0 /100 | #15 | Exceptional 45.1% |
| Immigrants | Northern Europe | 100.0 /100 | #16 | Exceptional 45.2% |
| Immigrants | India | 100.0 /100 | #17 | Exceptional 45.2% |
| Bolivians | 100.0 /100 | #18 | Exceptional 45.2% |
| Immigrants | Greece | 100.0 /100 | #19 | Exceptional 45.2% |
| Immigrants | Serbia | 100.0 /100 | #20 | Exceptional 45.3% |