Kiowa vs Immigrants from Uganda Disability Age Over 75
COMPARE
Kiowa
Immigrants from Uganda
Disability Age Over 75
Disability Age Over 75 Comparison
Kiowa
Immigrants from Uganda
54.2%
DISABILITY AGE OVER 75
0.0/ 100
METRIC RATING
335th/ 347
METRIC RANK
46.8%
DISABILITY AGE OVER 75
88.5/ 100
METRIC RATING
137th/ 347
METRIC RANK
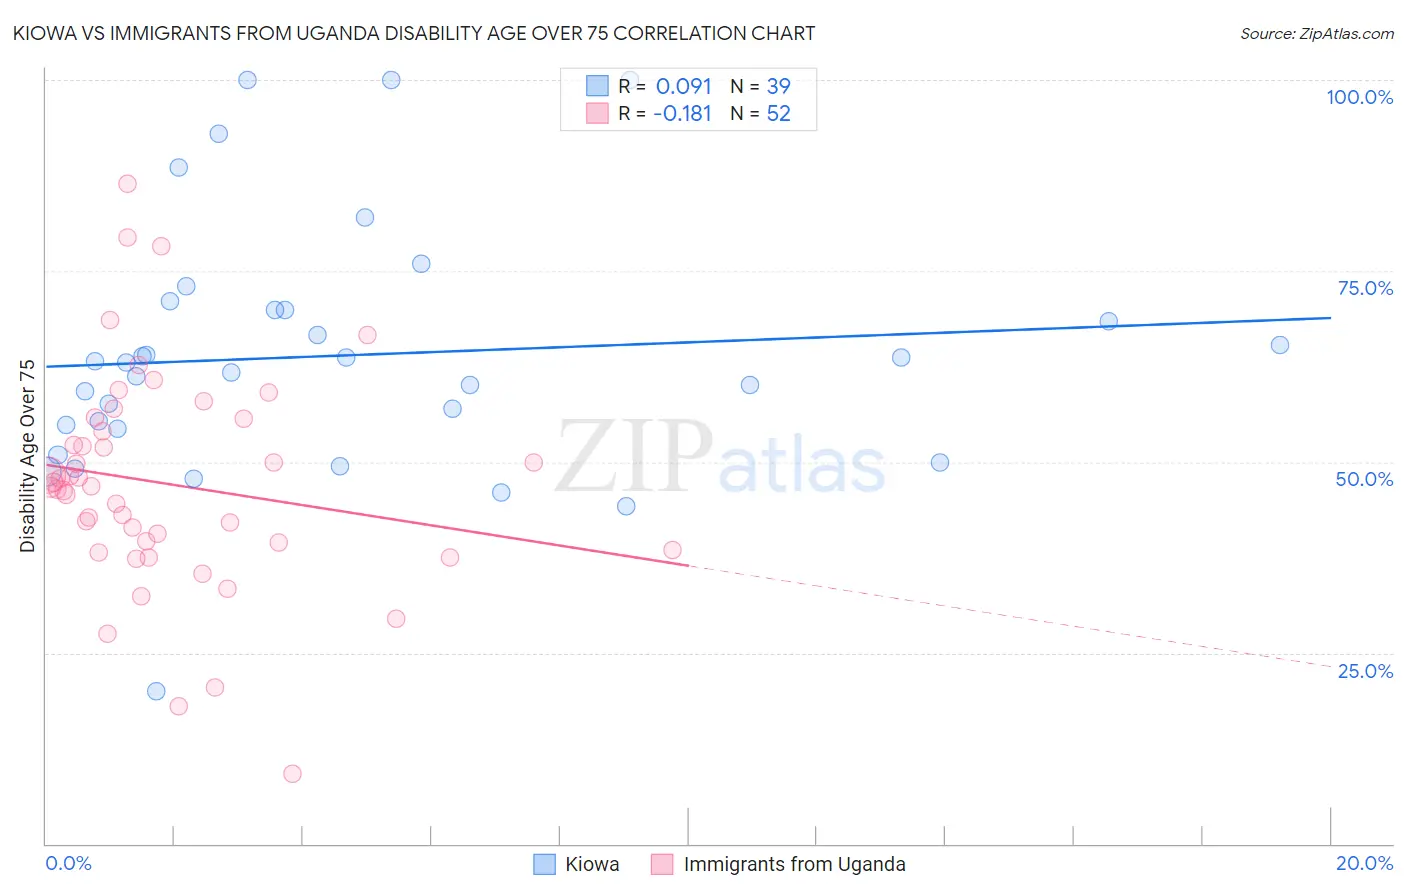
Kiowa vs Immigrants from Uganda Disability Age Over 75 Correlation Chart
The statistical analysis conducted on geographies consisting of 56,070,567 people shows a slight positive correlation between the proportion of Kiowa and percentage of population with a disability over the age of 75 in the United States with a correlation coefficient (R) of 0.091 and weighted average of 54.2%. Similarly, the statistical analysis conducted on geographies consisting of 125,949,888 people shows a poor negative correlation between the proportion of Immigrants from Uganda and percentage of population with a disability over the age of 75 in the United States with a correlation coefficient (R) of -0.181 and weighted average of 46.8%, a difference of 15.9%.
Disability Age Over 75 Correlation Summary
| Measurement | Kiowa | Immigrants from Uganda |
| Minimum | 20.0% | 9.2% |
| Maximum | 100.0% | 86.5% |
| Range | 80.0% | 77.3% |
| Mean | 63.9% | 47.1% |
| Median | 63.0% | 46.8% |
| Interquartile 25% (IQ1) | 54.3% | 38.9% |
| Interquartile 75% (IQ3) | 69.9% | 54.8% |
| Interquartile Range (IQR) | 15.6% | 15.9% |
| Standard Deviation (Sample) | 16.5% | 14.4% |
| Standard Deviation (Population) | 16.3% | 14.3% |
Similar Demographics by Disability Age Over 75
Demographics Similar to Kiowa by Disability Age Over 75
In terms of disability age over 75, the demographic groups most similar to Kiowa are Immigrants from Armenia (54.3%, a difference of 0.17%), Yuman (54.4%, a difference of 0.33%), Alaskan Athabascan (54.0%, a difference of 0.53%), Apache (53.6%, a difference of 1.2%), and Colville (55.4%, a difference of 2.1%).
| Demographics | Rating | Rank | Disability Age Over 75 |
| Choctaw | 0.0 /100 | #328 | Tragic 52.7% |
| Alaska Natives | 0.0 /100 | #329 | Tragic 52.8% |
| Puerto Ricans | 0.0 /100 | #330 | Tragic 52.9% |
| Hopi | 0.0 /100 | #331 | Tragic 52.9% |
| Natives/Alaskans | 0.0 /100 | #332 | Tragic 53.1% |
| Apache | 0.0 /100 | #333 | Tragic 53.6% |
| Alaskan Athabascans | 0.0 /100 | #334 | Tragic 54.0% |
| Kiowa | 0.0 /100 | #335 | Tragic 54.2% |
| Immigrants | Armenia | 0.0 /100 | #336 | Tragic 54.3% |
| Yuman | 0.0 /100 | #337 | Tragic 54.4% |
| Colville | 0.0 /100 | #338 | Tragic 55.4% |
| Pima | 0.0 /100 | #339 | Tragic 55.8% |
| Pueblo | 0.0 /100 | #340 | Tragic 55.9% |
| Houma | 0.0 /100 | #341 | Tragic 56.2% |
| Lumbee | 0.0 /100 | #342 | Tragic 56.2% |
Demographics Similar to Immigrants from Uganda by Disability Age Over 75
In terms of disability age over 75, the demographic groups most similar to Immigrants from Uganda are Immigrants from Venezuela (46.8%, a difference of 0.0%), Immigrants from Bosnia and Herzegovina (46.8%, a difference of 0.0%), Yugoslavian (46.8%, a difference of 0.010%), Ethiopian (46.8%, a difference of 0.020%), and Immigrants from Ethiopia (46.8%, a difference of 0.030%).
| Demographics | Rating | Rank | Disability Age Over 75 |
| Immigrants | Northern Africa | 90.7 /100 | #130 | Exceptional 46.7% |
| Scottish | 90.5 /100 | #131 | Exceptional 46.7% |
| South Americans | 90.0 /100 | #132 | Excellent 46.8% |
| English | 89.4 /100 | #133 | Excellent 46.8% |
| Immigrants | Ethiopia | 89.1 /100 | #134 | Excellent 46.8% |
| Ethiopians | 88.9 /100 | #135 | Excellent 46.8% |
| Immigrants | Venezuela | 88.6 /100 | #136 | Excellent 46.8% |
| Immigrants | Uganda | 88.5 /100 | #137 | Excellent 46.8% |
| Immigrants | Bosnia and Herzegovina | 88.5 /100 | #138 | Excellent 46.8% |
| Yugoslavians | 88.5 /100 | #139 | Excellent 46.8% |
| Immigrants | Costa Rica | 87.4 /100 | #140 | Excellent 46.8% |
| Lebanese | 87.0 /100 | #141 | Excellent 46.8% |
| Peruvians | 86.5 /100 | #142 | Excellent 46.8% |
| Bermudans | 85.6 /100 | #143 | Excellent 46.9% |
| Venezuelans | 85.0 /100 | #144 | Excellent 46.9% |