Kiowa vs German Russian Vision Disability
COMPARE
Kiowa
German Russian
Vision Disability
Vision Disability Comparison
Kiowa
German Russians
3.3%
VISION DISABILITY
0.0/ 100
METRIC RATING
341st/ 347
METRIC RANK
2.3%
VISION DISABILITY
1.8/ 100
METRIC RATING
232nd/ 347
METRIC RANK
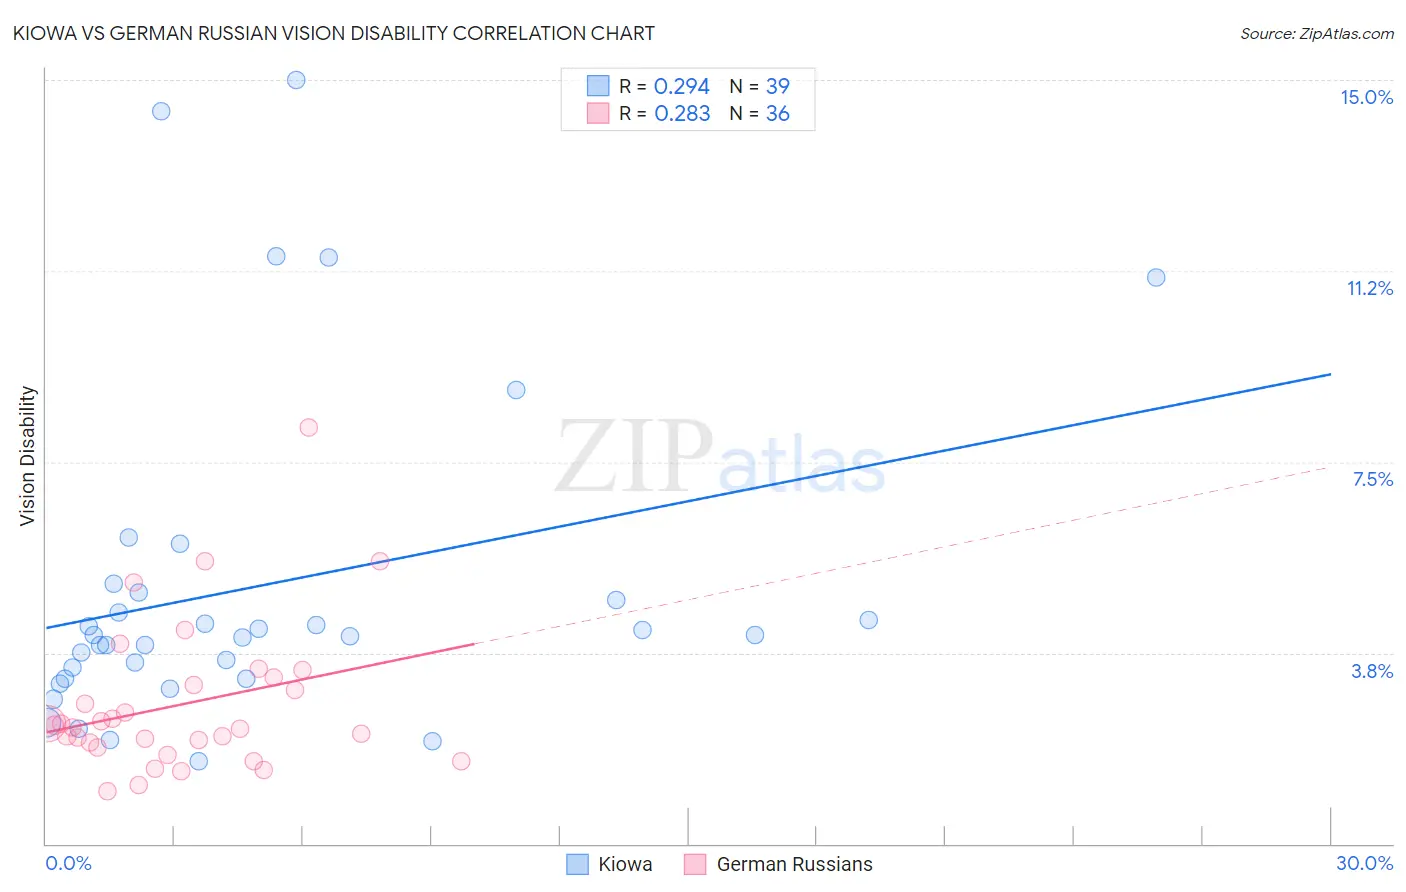
Kiowa vs German Russian Vision Disability Correlation Chart
The statistical analysis conducted on geographies consisting of 56,085,396 people shows a weak positive correlation between the proportion of Kiowa and percentage of population with vision disability in the United States with a correlation coefficient (R) of 0.294 and weighted average of 3.3%. Similarly, the statistical analysis conducted on geographies consisting of 96,448,558 people shows a weak positive correlation between the proportion of German Russians and percentage of population with vision disability in the United States with a correlation coefficient (R) of 0.283 and weighted average of 2.3%, a difference of 41.2%.
Vision Disability Correlation Summary
| Measurement | Kiowa | German Russian |
| Minimum | 1.6% | 1.0% |
| Maximum | 15.0% | 8.2% |
| Range | 13.4% | 7.1% |
| Mean | 5.1% | 2.7% |
| Median | 4.1% | 2.3% |
| Interquartile 25% (IQ1) | 3.2% | 1.9% |
| Interquartile 75% (IQ3) | 4.9% | 3.2% |
| Interquartile Range (IQR) | 1.7% | 1.2% |
| Standard Deviation (Sample) | 3.3% | 1.5% |
| Standard Deviation (Population) | 3.2% | 1.4% |
Similar Demographics by Vision Disability
Demographics Similar to Kiowa by Vision Disability
In terms of vision disability, the demographic groups most similar to Kiowa are Choctaw (3.3%, a difference of 1.4%), Creek (3.2%, a difference of 1.4%), Tsimshian (3.2%, a difference of 1.6%), Chickasaw (3.2%, a difference of 2.3%), and Pima (3.3%, a difference of 2.5%).
| Demographics | Rating | Rank | Vision Disability |
| Cajuns | 0.0 /100 | #333 | Tragic 3.1% |
| Cheyenne | 0.0 /100 | #334 | Tragic 3.1% |
| Navajo | 0.0 /100 | #335 | Tragic 3.1% |
| Alaskan Athabascans | 0.0 /100 | #336 | Tragic 3.1% |
| Dutch West Indians | 0.0 /100 | #337 | Tragic 3.2% |
| Chickasaw | 0.0 /100 | #338 | Tragic 3.2% |
| Tsimshian | 0.0 /100 | #339 | Tragic 3.2% |
| Creek | 0.0 /100 | #340 | Tragic 3.2% |
| Kiowa | 0.0 /100 | #341 | Tragic 3.3% |
| Choctaw | 0.0 /100 | #342 | Tragic 3.3% |
| Pima | 0.0 /100 | #343 | Tragic 3.3% |
| Pueblo | 0.0 /100 | #344 | Tragic 3.3% |
| Lumbee | 0.0 /100 | #345 | Tragic 3.4% |
| Houma | 0.0 /100 | #346 | Tragic 3.4% |
| Puerto Ricans | 0.0 /100 | #347 | Tragic 3.9% |
Demographics Similar to German Russians by Vision Disability
In terms of vision disability, the demographic groups most similar to German Russians are Central American (2.3%, a difference of 0.020%), Immigrants from Ecuador (2.3%, a difference of 0.19%), Scottish (2.3%, a difference of 0.20%), Marshallese (2.3%, a difference of 0.27%), and Nicaraguan (2.3%, a difference of 0.35%).
| Demographics | Rating | Rank | Vision Disability |
| Immigrants | Western Africa | 3.4 /100 | #225 | Tragic 2.3% |
| Immigrants | Germany | 3.0 /100 | #226 | Tragic 2.3% |
| Hawaiians | 2.9 /100 | #227 | Tragic 2.3% |
| Hmong | 2.5 /100 | #228 | Tragic 2.3% |
| Welsh | 2.3 /100 | #229 | Tragic 2.3% |
| Nicaraguans | 2.2 /100 | #230 | Tragic 2.3% |
| Immigrants | Ecuador | 2.0 /100 | #231 | Tragic 2.3% |
| German Russians | 1.8 /100 | #232 | Tragic 2.3% |
| Central Americans | 1.8 /100 | #233 | Tragic 2.3% |
| Scottish | 1.6 /100 | #234 | Tragic 2.3% |
| Marshallese | 1.5 /100 | #235 | Tragic 2.3% |
| Immigrants | Congo | 1.4 /100 | #236 | Tragic 2.3% |
| Immigrants | Portugal | 1.4 /100 | #237 | Tragic 2.3% |
| Immigrants | Cambodia | 1.1 /100 | #238 | Tragic 2.3% |
| English | 1.1 /100 | #239 | Tragic 2.3% |