Jamaican vs Immigrants from Croatia Female Disability
COMPARE
Jamaican
Immigrants from Croatia
Female Disability
Female Disability Comparison
Jamaicans
Immigrants from Croatia
12.7%
FEMALE DISABILITY
1.4/ 100
METRIC RATING
253rd/ 347
METRIC RANK
11.8%
FEMALE DISABILITY
96.7/ 100
METRIC RATING
123rd/ 347
METRIC RANK
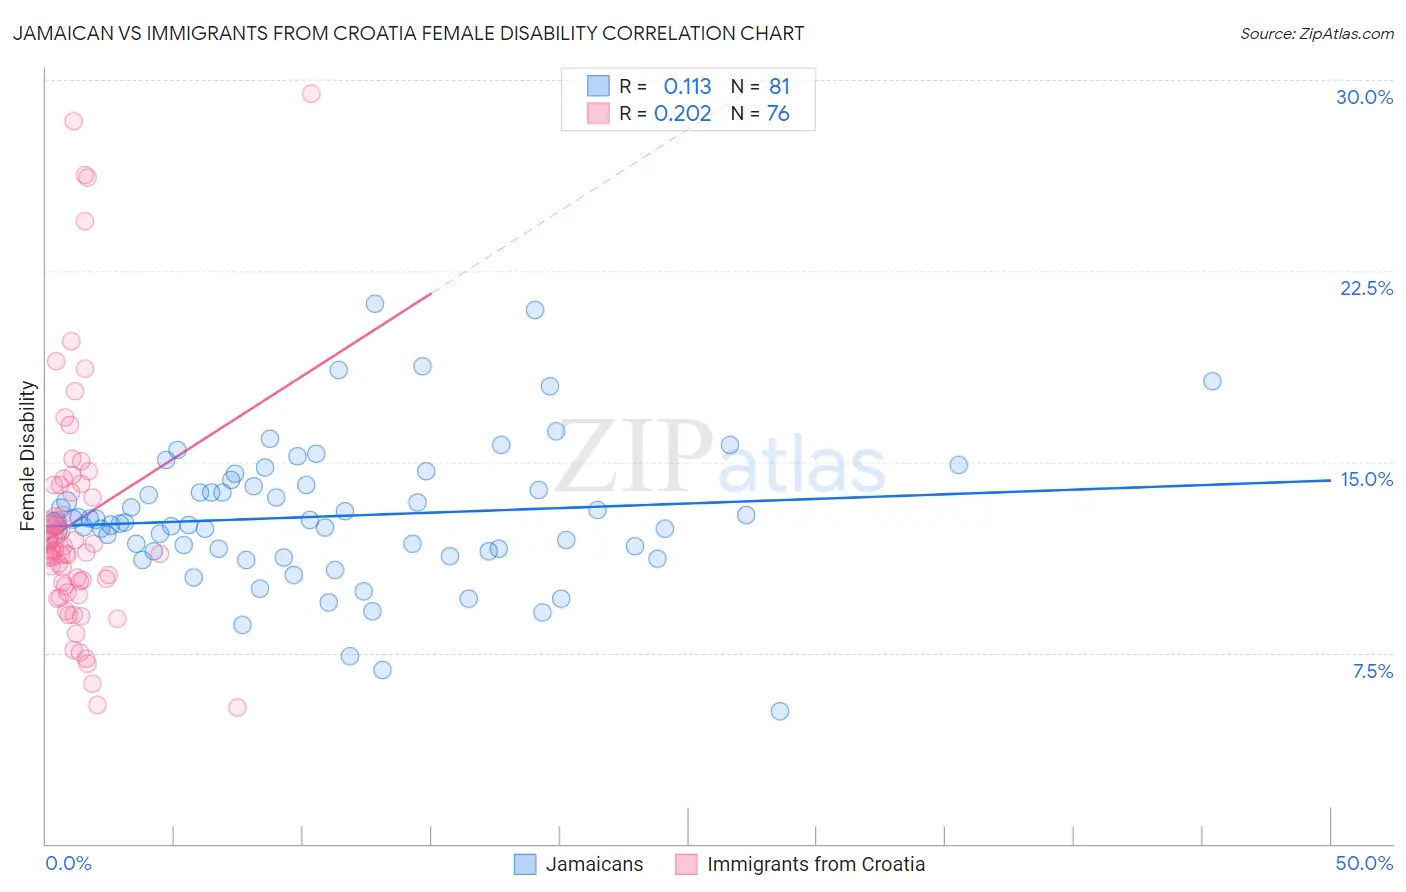
Jamaican vs Immigrants from Croatia Female Disability Correlation Chart
The statistical analysis conducted on geographies consisting of 367,961,325 people shows a poor positive correlation between the proportion of Jamaicans and percentage of females with a disability in the United States with a correlation coefficient (R) of 0.113 and weighted average of 12.7%. Similarly, the statistical analysis conducted on geographies consisting of 132,577,036 people shows a weak positive correlation between the proportion of Immigrants from Croatia and percentage of females with a disability in the United States with a correlation coefficient (R) of 0.202 and weighted average of 11.8%, a difference of 7.4%.
Female Disability Correlation Summary
| Measurement | Jamaican | Immigrants from Croatia |
| Minimum | 5.2% | 5.3% |
| Maximum | 21.2% | 29.4% |
| Range | 16.0% | 24.1% |
| Mean | 12.9% | 12.7% |
| Median | 12.6% | 11.6% |
| Interquartile 25% (IQ1) | 11.5% | 10.3% |
| Interquartile 75% (IQ3) | 14.1% | 13.9% |
| Interquartile Range (IQR) | 2.6% | 3.6% |
| Standard Deviation (Sample) | 2.8% | 4.8% |
| Standard Deviation (Population) | 2.7% | 4.7% |
Similar Demographics by Female Disability
Demographics Similar to Jamaicans by Female Disability
In terms of female disability, the demographic groups most similar to Jamaicans are Immigrants from Caribbean (12.7%, a difference of 0.010%), Hawaiian (12.7%, a difference of 0.030%), Crow (12.7%, a difference of 0.090%), Immigrants from Germany (12.7%, a difference of 0.11%), and Slovene (12.7%, a difference of 0.15%).
| Demographics | Rating | Rank | Female Disability |
| Spanish American Indians | 2.1 /100 | #246 | Tragic 12.6% |
| Menominee | 2.1 /100 | #247 | Tragic 12.6% |
| Carpatho Rusyns | 2.0 /100 | #248 | Tragic 12.6% |
| Immigrants | Congo | 1.8 /100 | #249 | Tragic 12.7% |
| Slovenes | 1.7 /100 | #250 | Tragic 12.7% |
| Crow | 1.6 /100 | #251 | Tragic 12.7% |
| Immigrants | Caribbean | 1.4 /100 | #252 | Tragic 12.7% |
| Jamaicans | 1.4 /100 | #253 | Tragic 12.7% |
| Hawaiians | 1.4 /100 | #254 | Tragic 12.7% |
| Immigrants | Germany | 1.3 /100 | #255 | Tragic 12.7% |
| British West Indians | 1.2 /100 | #256 | Tragic 12.7% |
| Liberians | 1.1 /100 | #257 | Tragic 12.7% |
| Aleuts | 1.1 /100 | #258 | Tragic 12.7% |
| Immigrants | Armenia | 1.0 /100 | #259 | Tragic 12.7% |
| Sub-Saharan Africans | 1.0 /100 | #260 | Tragic 12.7% |
Demographics Similar to Immigrants from Croatia by Female Disability
In terms of female disability, the demographic groups most similar to Immigrants from Croatia are Immigrants from North Macedonia (11.8%, a difference of 0.050%), Russian (11.8%, a difference of 0.050%), Immigrants from Netherlands (11.8%, a difference of 0.060%), Immigrants from Italy (11.8%, a difference of 0.070%), and Immigrants from Kazakhstan (11.8%, a difference of 0.090%).
| Demographics | Rating | Rank | Female Disability |
| Immigrants | Morocco | 97.6 /100 | #116 | Exceptional 11.8% |
| Immigrants | Eastern Europe | 97.2 /100 | #117 | Exceptional 11.8% |
| Immigrants | Nigeria | 97.2 /100 | #118 | Exceptional 11.8% |
| Immigrants | Uganda | 97.2 /100 | #119 | Exceptional 11.8% |
| Immigrants | Kazakhstan | 97.0 /100 | #120 | Exceptional 11.8% |
| Immigrants | Netherlands | 96.9 /100 | #121 | Exceptional 11.8% |
| Immigrants | North Macedonia | 96.8 /100 | #122 | Exceptional 11.8% |
| Immigrants | Croatia | 96.7 /100 | #123 | Exceptional 11.8% |
| Russians | 96.5 /100 | #124 | Exceptional 11.8% |
| Immigrants | Italy | 96.4 /100 | #125 | Exceptional 11.8% |
| Immigrants | Europe | 96.2 /100 | #126 | Exceptional 11.8% |
| South American Indians | 95.8 /100 | #127 | Exceptional 11.8% |
| Immigrants | Latvia | 95.6 /100 | #128 | Exceptional 11.8% |
| Macedonians | 95.5 /100 | #129 | Exceptional 11.8% |
| Nicaraguans | 95.2 /100 | #130 | Exceptional 11.9% |