Italian vs Immigrants from Thailand Vision Disability
COMPARE
Italian
Immigrants from Thailand
Vision Disability
Vision Disability Comparison
Italians
Immigrants from Thailand
2.1%
VISION DISABILITY
79.7/ 100
METRIC RATING
146th/ 347
METRIC RANK
2.2%
VISION DISABILITY
20.1/ 100
METRIC RATING
200th/ 347
METRIC RANK
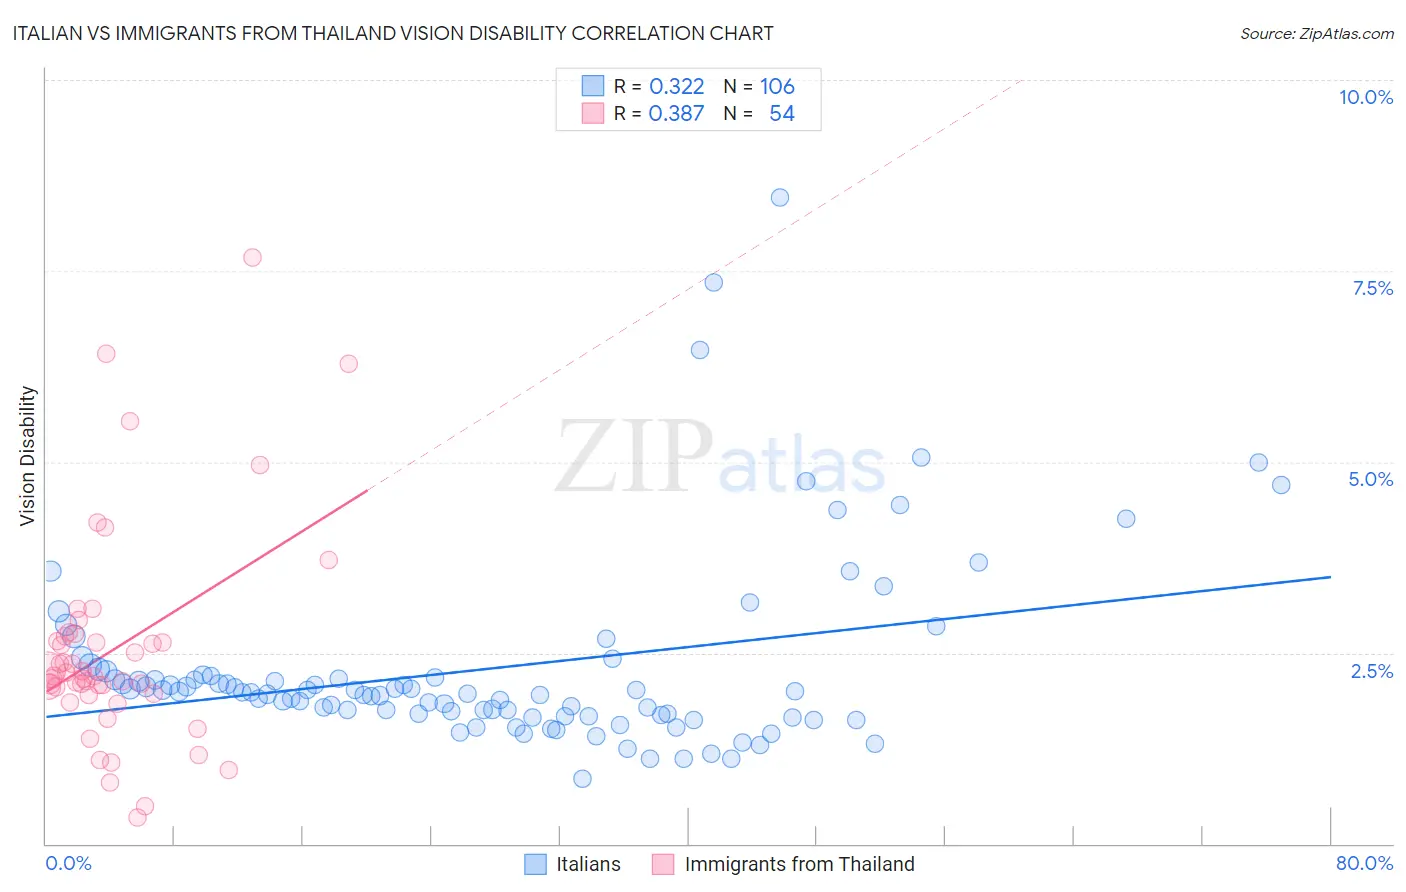
Italian vs Immigrants from Thailand Vision Disability Correlation Chart
The statistical analysis conducted on geographies consisting of 572,776,959 people shows a mild positive correlation between the proportion of Italians and percentage of population with vision disability in the United States with a correlation coefficient (R) of 0.322 and weighted average of 2.1%. Similarly, the statistical analysis conducted on geographies consisting of 316,876,708 people shows a mild positive correlation between the proportion of Immigrants from Thailand and percentage of population with vision disability in the United States with a correlation coefficient (R) of 0.387 and weighted average of 2.2%, a difference of 4.4%.
Vision Disability Correlation Summary
| Measurement | Italian | Immigrants from Thailand |
| Minimum | 0.86% | 0.34% |
| Maximum | 8.5% | 7.7% |
| Range | 7.6% | 7.3% |
| Mean | 2.3% | 2.5% |
| Median | 2.0% | 2.2% |
| Interquartile 25% (IQ1) | 1.7% | 2.0% |
| Interquartile 75% (IQ3) | 2.2% | 2.7% |
| Interquartile Range (IQR) | 0.51% | 0.75% |
| Standard Deviation (Sample) | 1.2% | 1.4% |
| Standard Deviation (Population) | 1.2% | 1.4% |
Similar Demographics by Vision Disability
Demographics Similar to Italians by Vision Disability
In terms of vision disability, the demographic groups most similar to Italians are Immigrants from Sudan (2.1%, a difference of 0.13%), Finnish (2.1%, a difference of 0.14%), Immigrants from Bosnia and Herzegovina (2.1%, a difference of 0.18%), Ukrainian (2.1%, a difference of 0.23%), and South American (2.1%, a difference of 0.33%).
| Demographics | Rating | Rank | Vision Disability |
| Immigrants | Morocco | 85.2 /100 | #139 | Excellent 2.1% |
| Immigrants | Netherlands | 84.2 /100 | #140 | Excellent 2.1% |
| Sierra Leoneans | 84.1 /100 | #141 | Excellent 2.1% |
| South Americans | 82.8 /100 | #142 | Excellent 2.1% |
| Immigrants | Sierra Leone | 82.8 /100 | #143 | Excellent 2.1% |
| Ukrainians | 81.9 /100 | #144 | Excellent 2.1% |
| Immigrants | Bosnia and Herzegovina | 81.5 /100 | #145 | Excellent 2.1% |
| Italians | 79.7 /100 | #146 | Good 2.1% |
| Immigrants | Sudan | 78.4 /100 | #147 | Good 2.1% |
| Finns | 78.3 /100 | #148 | Good 2.1% |
| Colombians | 76.2 /100 | #149 | Good 2.1% |
| Belgians | 75.9 /100 | #150 | Good 2.1% |
| Immigrants | Norway | 75.5 /100 | #151 | Good 2.1% |
| Immigrants | Southern Europe | 74.6 /100 | #152 | Good 2.1% |
| Immigrants | South America | 73.8 /100 | #153 | Good 2.1% |
Demographics Similar to Immigrants from Thailand by Vision Disability
In terms of vision disability, the demographic groups most similar to Immigrants from Thailand are Immigrants from El Salvador (2.2%, a difference of 0.090%), Slovak (2.2%, a difference of 0.13%), Czechoslovakian (2.2%, a difference of 0.14%), Ghanaian (2.2%, a difference of 0.16%), and Immigrants from Zaire (2.2%, a difference of 0.22%).
| Demographics | Rating | Rank | Vision Disability |
| British | 25.1 /100 | #193 | Fair 2.2% |
| Immigrants | Barbados | 24.0 /100 | #194 | Fair 2.2% |
| Immigrants | Immigrants | 23.7 /100 | #195 | Fair 2.2% |
| Immigrants | Grenada | 23.1 /100 | #196 | Fair 2.2% |
| Ghanaians | 21.8 /100 | #197 | Fair 2.2% |
| Czechoslovakians | 21.6 /100 | #198 | Fair 2.2% |
| Immigrants | El Salvador | 21.0 /100 | #199 | Fair 2.2% |
| Immigrants | Thailand | 20.1 /100 | #200 | Fair 2.2% |
| Slovaks | 18.8 /100 | #201 | Poor 2.2% |
| Immigrants | Zaire | 18.0 /100 | #202 | Poor 2.2% |
| Dutch | 17.1 /100 | #203 | Poor 2.2% |
| Immigrants | Guyana | 15.9 /100 | #204 | Poor 2.2% |
| Samoans | 15.7 /100 | #205 | Poor 2.2% |
| Pennsylvania Germans | 14.5 /100 | #206 | Poor 2.2% |
| Immigrants | Nigeria | 13.5 /100 | #207 | Poor 2.2% |