Iranian vs German Russian Male Disability
COMPARE
Iranian
German Russian
Male Disability
Male Disability Comparison
Iranians
German Russians
9.7%
MALE DISABILITY
100.0/ 100
METRIC RATING
13th/ 347
METRIC RANK
12.0%
MALE DISABILITY
0.5/ 100
METRIC RATING
251st/ 347
METRIC RANK
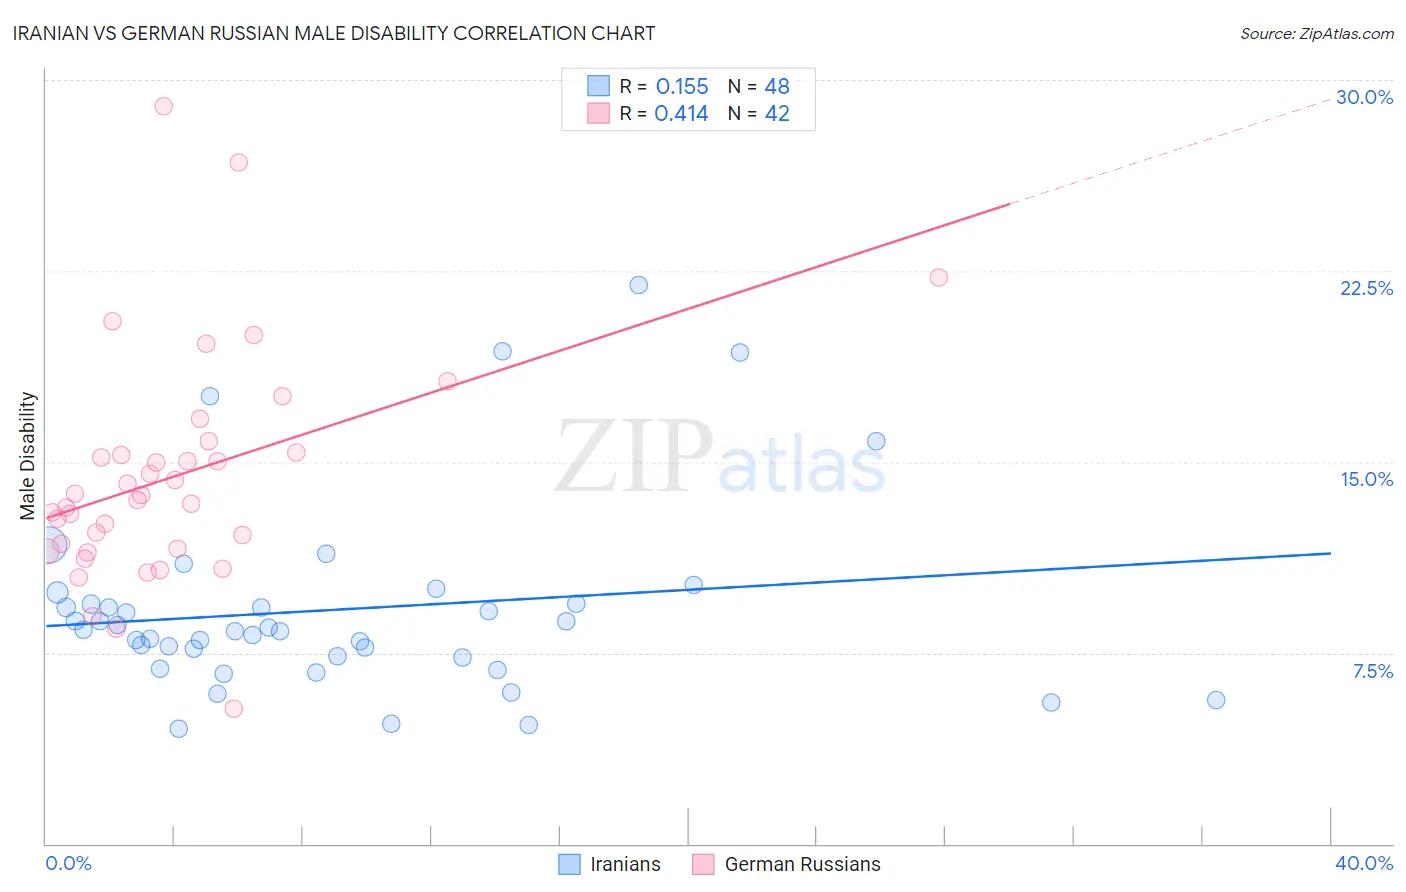
Iranian vs German Russian Male Disability Correlation Chart
The statistical analysis conducted on geographies consisting of 316,851,194 people shows a poor positive correlation between the proportion of Iranians and percentage of males with a disability in the United States with a correlation coefficient (R) of 0.155 and weighted average of 9.7%. Similarly, the statistical analysis conducted on geographies consisting of 96,458,633 people shows a moderate positive correlation between the proportion of German Russians and percentage of males with a disability in the United States with a correlation coefficient (R) of 0.414 and weighted average of 12.0%, a difference of 24.5%.
Male Disability Correlation Summary
| Measurement | Iranian | German Russian |
| Minimum | 4.5% | 5.3% |
| Maximum | 21.9% | 29.0% |
| Range | 17.4% | 23.7% |
| Mean | 9.2% | 14.4% |
| Median | 8.4% | 13.6% |
| Interquartile 25% (IQ1) | 7.4% | 11.6% |
| Interquartile 75% (IQ3) | 9.4% | 15.4% |
| Interquartile Range (IQR) | 2.1% | 3.8% |
| Standard Deviation (Sample) | 3.7% | 4.5% |
| Standard Deviation (Population) | 3.7% | 4.4% |
Similar Demographics by Male Disability
Demographics Similar to Iranians by Male Disability
In terms of male disability, the demographic groups most similar to Iranians are Immigrants from Iran (9.7%, a difference of 0.10%), Bolivian (9.6%, a difference of 0.23%), Immigrants from Eastern Asia (9.6%, a difference of 0.46%), Indian (Asian) (9.7%, a difference of 0.55%), and Immigrants from Israel (9.6%, a difference of 1.0%).
| Demographics | Rating | Rank | Male Disability |
| Immigrants | South Central Asia | 100.0 /100 | #6 | Exceptional 9.4% |
| Immigrants | Bolivia | 100.0 /100 | #7 | Exceptional 9.5% |
| Immigrants | China | 100.0 /100 | #8 | Exceptional 9.5% |
| Immigrants | Singapore | 100.0 /100 | #9 | Exceptional 9.5% |
| Immigrants | Israel | 100.0 /100 | #10 | Exceptional 9.6% |
| Immigrants | Eastern Asia | 100.0 /100 | #11 | Exceptional 9.6% |
| Bolivians | 100.0 /100 | #12 | Exceptional 9.6% |
| Iranians | 100.0 /100 | #13 | Exceptional 9.7% |
| Immigrants | Iran | 100.0 /100 | #14 | Exceptional 9.7% |
| Indians (Asian) | 100.0 /100 | #15 | Exceptional 9.7% |
| Okinawans | 100.0 /100 | #16 | Exceptional 9.8% |
| Immigrants | Korea | 100.0 /100 | #17 | Exceptional 9.8% |
| Immigrants | Pakistan | 100.0 /100 | #18 | Exceptional 9.8% |
| Immigrants | Sri Lanka | 100.0 /100 | #19 | Exceptional 10.0% |
| Asians | 100.0 /100 | #20 | Exceptional 10.0% |
Demographics Similar to German Russians by Male Disability
In terms of male disability, the demographic groups most similar to German Russians are Bangladeshi (12.0%, a difference of 0.010%), Immigrants from Yemen (12.0%, a difference of 0.060%), Slovene (12.0%, a difference of 0.070%), Guamanian/Chamorro (12.0%, a difference of 0.070%), and British (12.1%, a difference of 0.26%).
| Demographics | Rating | Rank | Male Disability |
| Immigrants | Laos | 1.0 /100 | #244 | Tragic 11.9% |
| Immigrants | Liberia | 1.0 /100 | #245 | Tragic 11.9% |
| Danes | 0.9 /100 | #246 | Tragic 11.9% |
| Hungarians | 0.8 /100 | #247 | Tragic 12.0% |
| Poles | 0.7 /100 | #248 | Tragic 12.0% |
| Immigrants | Yemen | 0.5 /100 | #249 | Tragic 12.0% |
| Bangladeshis | 0.5 /100 | #250 | Tragic 12.0% |
| German Russians | 0.5 /100 | #251 | Tragic 12.0% |
| Slovenes | 0.5 /100 | #252 | Tragic 12.0% |
| Guamanians/Chamorros | 0.5 /100 | #253 | Tragic 12.0% |
| British | 0.4 /100 | #254 | Tragic 12.1% |
| Chinese | 0.4 /100 | #255 | Tragic 12.1% |
| Swiss | 0.3 /100 | #256 | Tragic 12.1% |
| Europeans | 0.3 /100 | #257 | Tragic 12.1% |
| Basques | 0.3 /100 | #258 | Tragic 12.1% |