Immigrants from Zimbabwe vs Ethiopian Disability Age 5 to 17

COMPARE

Immigrants from Zimbabwe
Race
Ancestry
AfghanAfricanAlaska NativeAlaskan AthabascanAlbanianAleutAlsatianAmericanApacheArabArapahoArgentineanArmenianAssyrian/Chaldean/SyriacAustralianAustrianBahamianBangladeshiBarbadianBasqueBelgianBelizeanBermudanBhutaneseBlackfeetBolivianBrazilianBritishBritish West IndianBulgarianBurmeseCajunCambodianCanadianCape VerdeanCarpatho RusynCelticCentral AmericanCentral American IndianCherokeeCheyenneChickasawChileanChineseChippewaChoctawColombianColvilleComancheCosta RicanCreeCreekCroatianCrowCubanCypriotCzechCzechoslovakianDanishDelawareDominicanDutchDutch West IndianEastern EuropeanEcuadorianEgyptianEnglishEstonianEuropeanFijianFilipinoFinnishFrenchFrench American IndianFrench CanadianGermanGerman RussianGhanaianGreekGuamanian/ChamorroGuatemalanGuyaneseHaitianHmongHonduranHopiHoumaHungarianIcelanderIndian (Asian)IndonesianInupiatIranianIraqiIrishIroquoisIsraeliItalianJamaicanJapaneseJordanianKenyanKiowaKoreanLaotianLatvianLebaneseLiberianLithuanianLumbeeLuxembourgerMacedonianMalaysianMalteseMarshalleseMenomineeMexicanMexican American IndianMongolianMoroccanNative HawaiianNavajoNepaleseNew ZealanderNicaraguanNigerianNorthern EuropeanNorwegianOkinawanOsageOttawaPaiutePakistaniPalestinianPanamanianParaguayanPennsylvania GermanPeruvianPimaPolishPortuguesePotawatomiPuebloPuerto RicanPuget Sound SalishRomanianRussianSalvadoranSamoanScandinavianScotch-IrishScottishSeminoleSenegaleseSerbianShoshoneSierra LeoneanSiouxSlavicSlovakSloveneSomaliSouth AfricanSouth AmericanSouth American IndianSoviet UnionSpaniardSpanishSpanish AmericanSpanish American IndianSri LankanSubsaharan AfricanSudaneseSwedishSwissSyrianTaiwaneseThaiTlingit-HaidaTohono O'OdhamTonganTrinidadian and TobagonianTsimshianTurkishU.S. Virgin IslanderUgandanUkrainianUruguayanUteVenezuelanVietnameseWelshWest IndianYakamaYaquiYugoslavianYumanYup'ikZimbabwean
Immigration
NonimmigrantsImmigrantsAfghanistanAfricaAlbaniaArgentinaArmeniaAsiaAustraliaAustriaBahamasBangladeshBarbadosBelarusBelgiumBelizeBoliviaBosnia and HerzegovinaBrazilBulgariaBurma/MyanmarCabo VerdeCambodiaCameroonCanadaCaribbeanCentral AmericaChileChinaColombiaCongoCosta RicaCroatiaCubaCzechoslovakiaDenmarkDominicaDominican RepublicEastern AfricaEastern AsiaEastern EuropeEcuadorEgyptEl SalvadorEnglandEritreaEthiopiaEuropeFijiFranceGermanyGhanaGreeceGrenadaGuatemalaGuyanaHaitiHondurasHong KongHungaryIndiaIndonesiaIranIraqIrelandIsraelItalyJamaicaJapanJordanKazakhstanKenyaKoreaKuwaitLaosLatin AmericaLatviaLebanonLiberiaLithuaniaMalaysiaMexicoMicronesiaMiddle AfricaMoldovaMoroccoNepalNetherlandsNicaraguaNigeriaNorth AmericaNorth MacedoniaNorthern AfricaNorthern EuropeNorwayOceaniaPakistanPanamaPeruPhilippinesPolandPortugalRomaniaRussiaSaudi ArabiaScotlandSenegalSerbiaSierra LeoneSingaporeSomaliaSouth AfricaSouth AmericaSouth Central AsiaSouth Eastern AsiaSouthern EuropeSpainSri LankaSt. Vincent and the GrenadinesSudanSwedenSwitzerlandSyriaTaiwanThailandTrinidad and TobagoTurkeyUgandaUkraineUruguayUzbekistanVenezuelaVietnamWest IndiesWestern AfricaWestern AsiaWestern EuropeYemenZaireZimbabweAzores
Ethiopian
Race
Ancestry
AfghanAfricanAlaska NativeAlaskan AthabascanAlbanianAleutAlsatianAmericanApacheArabArapahoArgentineanArmenianAssyrian/Chaldean/SyriacAustralianAustrianBahamianBangladeshiBarbadianBasqueBelgianBelizeanBermudanBhutaneseBlackfeetBolivianBrazilianBritishBritish West IndianBulgarianBurmeseCajunCambodianCanadianCape VerdeanCarpatho RusynCelticCentral AmericanCentral American IndianCherokeeCheyenneChickasawChileanChineseChippewaChoctawColombianColvilleComancheCosta RicanCreeCreekCroatianCrowCubanCypriotCzechCzechoslovakianDanishDelawareDominicanDutchDutch West IndianEastern EuropeanEcuadorianEgyptianEnglishEstonianEthiopianEuropeanFijianFilipinoFinnishFrenchFrench American IndianFrench CanadianGermanGerman RussianGhanaianGreekGuamanian/ChamorroGuatemalanGuyaneseHaitianHmongHonduranHopiHoumaHungarianIcelanderIndian (Asian)IndonesianInupiatIranianIraqiIrishIroquoisIsraeliItalianJamaicanJapaneseJordanianKenyanKiowaKoreanLaotianLatvianLebaneseLiberianLithuanianLumbeeLuxembourgerMacedonianMalaysianMalteseMarshalleseMenomineeMexicanMexican American IndianMongolianMoroccanNative HawaiianNavajoNepaleseNew ZealanderNicaraguanNigerianNorthern EuropeanNorwegianOkinawanOsageOttawaPaiutePakistaniPalestinianPanamanianParaguayanPennsylvania GermanPeruvianPimaPolishPortuguesePotawatomiPuebloPuerto RicanPuget Sound SalishRomanianRussianSalvadoranSamoanScandinavianScotch-IrishScottishSeminoleSenegaleseSerbianShoshoneSierra LeoneanSiouxSlavicSlovakSloveneSomaliSouth AfricanSouth AmericanSouth American IndianSoviet UnionSpaniardSpanishSpanish AmericanSpanish American IndianSri LankanSubsaharan AfricanSudaneseSwedishSwissSyrianTaiwaneseThaiTlingit-HaidaTohono O'OdhamTonganTrinidadian and TobagonianTsimshianTurkishU.S. Virgin IslanderUgandanUkrainianUruguayanUteVenezuelanVietnameseWelshWest IndianYakamaYaquiYugoslavianYumanYup'ikZimbabwean
Immigration
NonimmigrantsImmigrantsAfghanistanAfricaAlbaniaArgentinaArmeniaAsiaAustraliaAustriaBahamasBangladeshBarbadosBelarusBelgiumBelizeBoliviaBosnia and HerzegovinaBrazilBulgariaBurma/MyanmarCabo VerdeCambodiaCameroonCanadaCaribbeanCentral AmericaChileChinaColombiaCongoCosta RicaCroatiaCubaCzechoslovakiaDenmarkDominicaDominican RepublicEastern AfricaEastern AsiaEastern EuropeEcuadorEgyptEl SalvadorEnglandEritreaEthiopiaEuropeFijiFranceGermanyGhanaGreeceGrenadaGuatemalaGuyanaHaitiHondurasHong KongHungaryIndiaIndonesiaIranIraqIrelandIsraelItalyJamaicaJapanJordanKazakhstanKenyaKoreaKuwaitLaosLatin AmericaLatviaLebanonLiberiaLithuaniaMalaysiaMexicoMicronesiaMiddle AfricaMoldovaMoroccoNepalNetherlandsNicaraguaNigeriaNorth AmericaNorth MacedoniaNorthern AfricaNorthern EuropeNorwayOceaniaPakistanPanamaPeruPhilippinesPolandPortugalRomaniaRussiaSaudi ArabiaScotlandSenegalSerbiaSierra LeoneSingaporeSomaliaSouth AfricaSouth AmericaSouth Central AsiaSouth Eastern AsiaSouthern EuropeSpainSri LankaSt. Vincent and the GrenadinesSudanSwedenSwitzerlandSyriaTaiwanThailandTrinidad and TobagoTurkeyUgandaUkraineUruguayUzbekistanVenezuelaVietnamWest IndiesWestern AfricaWestern AsiaWestern EuropeYemenZaireAzores
Disability Age 5 to 17
Income
Poverty
Unemployment
Labor Participation
Family Structure
Vehicle Availability
Education Level
Disability

Disability Age 5 to 17 Comparison

Immigrants from Zimbabwe

Ethiopians

Good
Exceptional
5.5%
DISABILITY AGE 5 TO 17
75.3/ 100
METRIC RATING
159th/ 347
METRIC RANK
5.3%
DISABILITY AGE 5 TO 17
97.9/ 100
METRIC RATING
111th/ 347
METRIC RANK

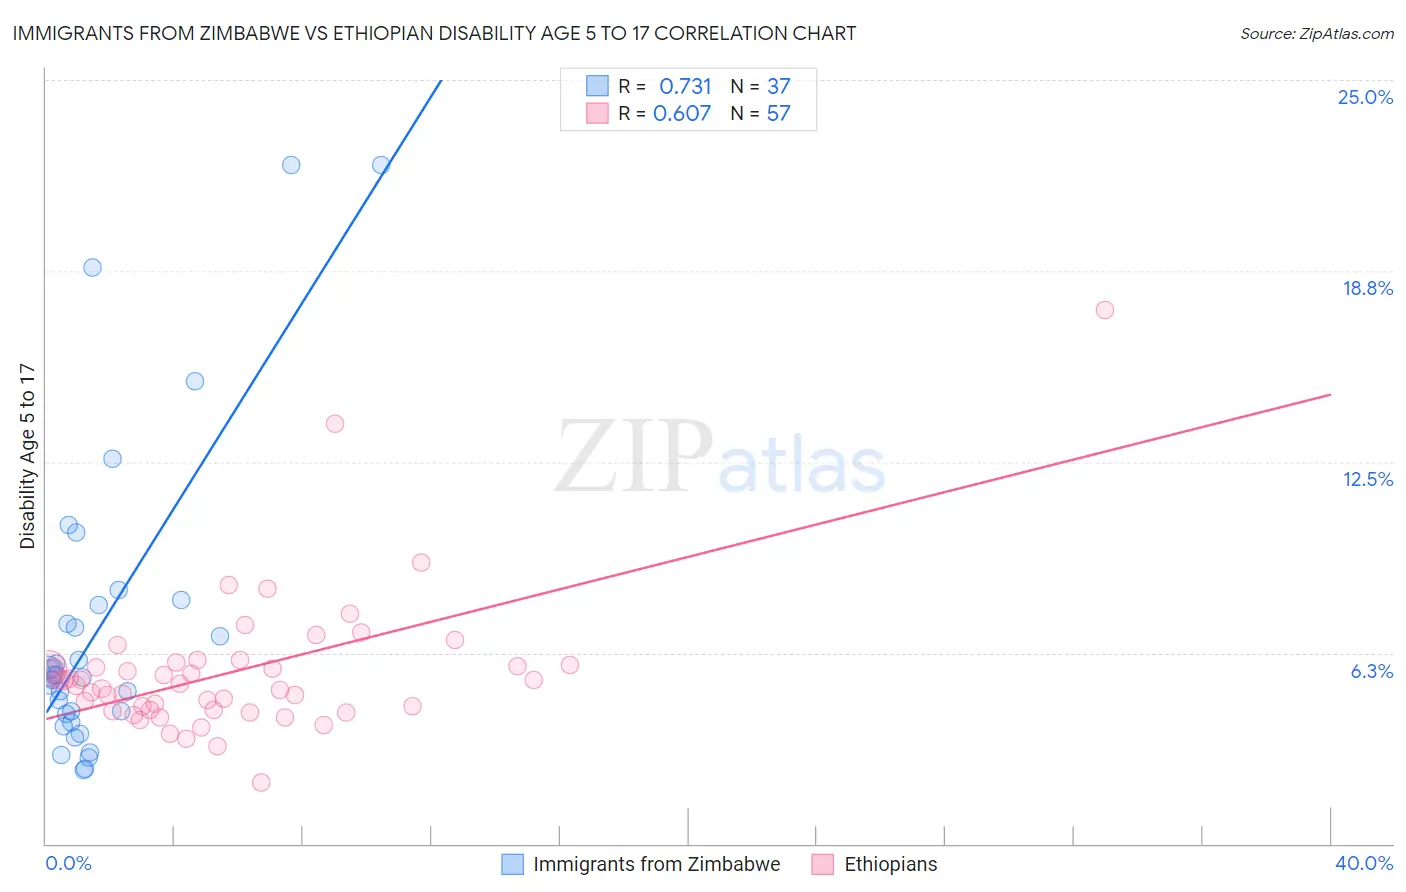
Immigrants from Zimbabwe vs Ethiopian Disability Age 5 to 17 Correlation Chart

The statistical analysis conducted on geographies consisting of 117,554,818 people shows a strong positive correlation between the proportion of Immigrants from Zimbabwe and percentage of population with a disability between the ages 5 and 17 in the United States with a correlation coefficient (R) of 0.731 and weighted average of 5.5%. Similarly, the statistical analysis conducted on geographies consisting of 222,418,387 people shows a significant positive correlation between the proportion of Ethiopians and percentage of population with a disability between the ages 5 and 17 in the United States with a correlation coefficient (R) of 0.607 and weighted average of 5.3%, a difference of 3.6%.
Immigrants from Zimbabwe vs Ethiopian Disability Age 5 to 17

Disability Age 5 to 17 Correlation Summary

MeasurementImmigrants from ZimbabweEthiopian
Minimum2.4%2.0%
Maximum22.2%17.5%
Range19.8%15.4%
Mean7.1%5.6%
Median5.5%5.2%
Interquartile 25% (IQ1)4.1%4.4%
Interquartile 75% (IQ3)7.9%5.9%
Interquartile Range (IQR)3.8%1.5%
Standard Deviation (Sample)5.0%2.3%
Standard Deviation (Population)5.0%2.3%

Similar Demographics by Disability Age 5 to 17

Demographics Similar to Immigrants from Zimbabwe by Disability Age 5 to 17

In terms of disability age 5 to 17, the demographic groups most similar to Immigrants from Zimbabwe are Immigrants from Nepal (5.5%, a difference of 0.13%), South African (5.5%, a difference of 0.13%), Immigrants from Costa Rica (5.5%, a difference of 0.18%), Hawaiian (5.5%, a difference of 0.19%), and Immigrants from Ecuador (5.5%, a difference of 0.21%).
DemographicsRating | RankDisability Age 5 to 17
Ute
80.6
/100
|
#152
Excellent
5.5%
Ecuadorians
79.7
/100
|
#153
Good
5.5%
Australians
78.8
/100
|
#154
Good
5.5%
Immigrants | Ecuador
78.3
/100
|
#155
Good
5.5%
Hawaiians
78.0
/100
|
#156
Good
5.5%
Immigrants | Costa Rica
77.9
/100
|
#157
Good
5.5%
Immigrants | Nepal
77.1
/100
|
#158
Good
5.5%
Immigrants | Zimbabwe
75.3
/100
|
#159
Good
5.5%
South Africans
73.3
/100
|
#160
Good
5.5%
Immigrants | Saudi Arabia
69.1
/100
|
#161
Good
5.5%
Zimbabweans
67.2
/100
|
#162
Good
5.5%
Immigrants | Southern Europe
64.0
/100
|
#163
Good
5.6%
Immigrants | Scotland
61.9
/100
|
#164
Good
5.6%
Lebanese
61.4
/100
|
#165
Good
5.6%
Greeks
60.6
/100
|
#166
Good
5.6%

Demographics Similar to Ethiopians by Disability Age 5 to 17

In terms of disability age 5 to 17, the demographic groups most similar to Ethiopians are Immigrants from Latvia (5.3%, a difference of 0.020%), Immigrants from Eritrea (5.3%, a difference of 0.040%), Aleut (5.3%, a difference of 0.060%), Immigrants from Northern Africa (5.3%, a difference of 0.080%), and Immigrants from Northern Europe (5.3%, a difference of 0.090%).
DemographicsRating | RankDisability Age 5 to 17
Peruvians
98.5
/100
|
#104
Exceptional
5.3%
Immigrants | Italy
98.4
/100
|
#105
Exceptional
5.3%
Immigrants | Yemen
98.2
/100
|
#106
Exceptional
5.3%
Russians
98.2
/100
|
#107
Exceptional
5.3%
Immigrants | South Africa
98.1
/100
|
#108
Exceptional
5.3%
Immigrants | Northern Africa
98.1
/100
|
#109
Exceptional
5.3%
Immigrants | Eritrea
98.0
/100
|
#110
Exceptional
5.3%
Ethiopians
97.9
/100
|
#111
Exceptional
5.3%
Immigrants | Latvia
97.9
/100
|
#112
Exceptional
5.3%
Aleuts
97.8
/100
|
#113
Exceptional
5.3%
Immigrants | Northern Europe
97.8
/100
|
#114
Exceptional
5.3%
Cubans
97.8
/100
|
#115
Exceptional
5.3%
Cypriots
97.7
/100
|
#116
Exceptional
5.3%
Immigrants | Afghanistan
97.4
/100
|
#117
Exceptional
5.3%
South Americans
97.1
/100
|
#118
Exceptional
5.4%