Immigrants from Uruguay vs Danish Disability Age Over 75
COMPARE
Immigrants from Uruguay
Danish
Disability Age Over 75
Disability Age Over 75 Comparison
Immigrants from Uruguay
Danes
46.4%
DISABILITY AGE OVER 75
96.7/ 100
METRIC RATING
107th/ 347
METRIC RANK
46.2%
DISABILITY AGE OVER 75
98.6/ 100
METRIC RATING
87th/ 347
METRIC RANK
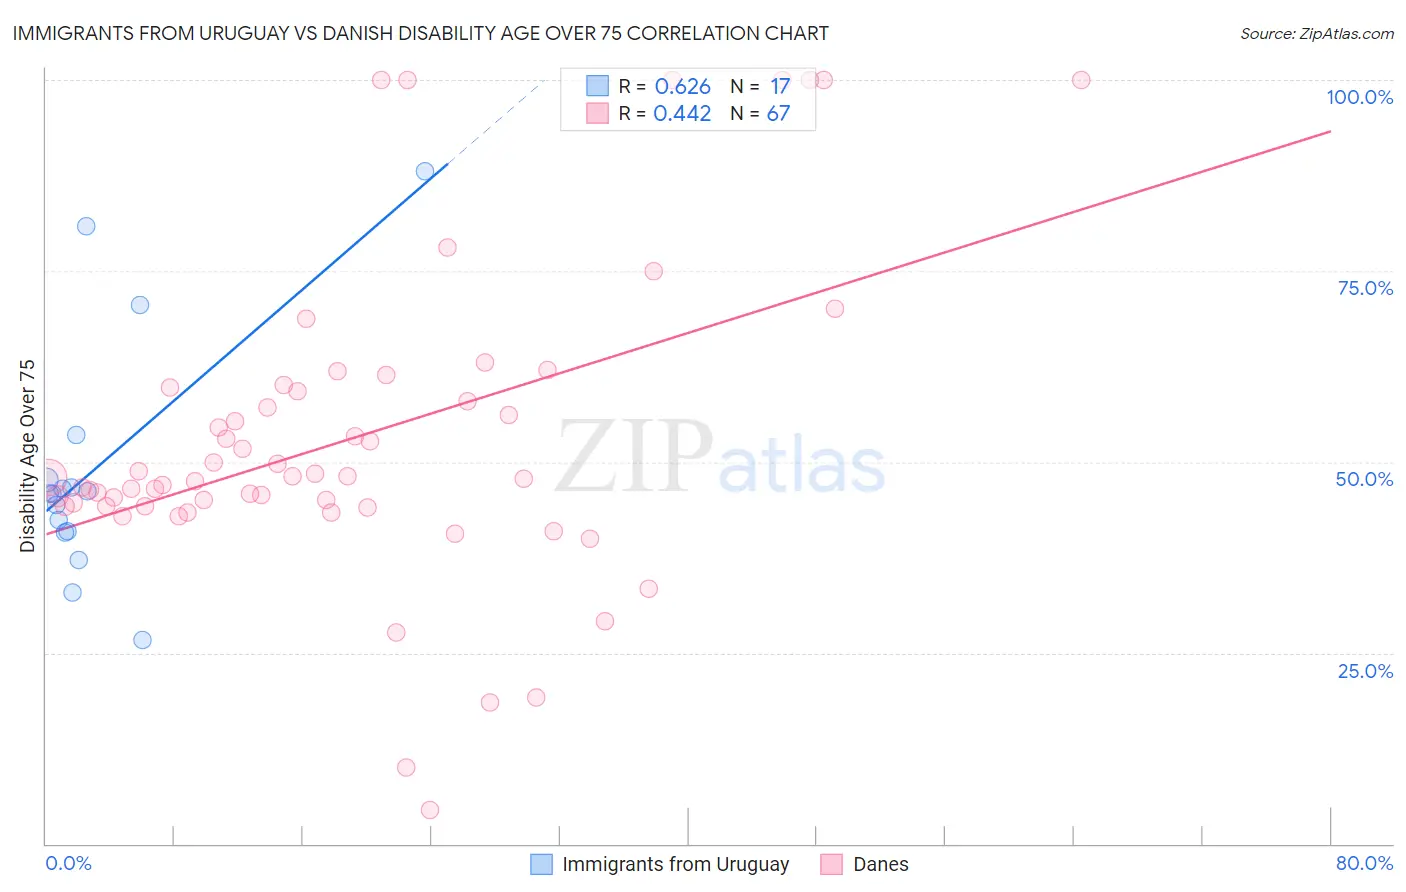
Immigrants from Uruguay vs Danish Disability Age Over 75 Correlation Chart
The statistical analysis conducted on geographies consisting of 133,242,093 people shows a significant positive correlation between the proportion of Immigrants from Uruguay and percentage of population with a disability over the age of 75 in the United States with a correlation coefficient (R) of 0.626 and weighted average of 46.4%. Similarly, the statistical analysis conducted on geographies consisting of 473,146,755 people shows a moderate positive correlation between the proportion of Danes and percentage of population with a disability over the age of 75 in the United States with a correlation coefficient (R) of 0.442 and weighted average of 46.2%, a difference of 0.52%.
Disability Age Over 75 Correlation Summary
| Measurement | Immigrants from Uruguay | Danish |
| Minimum | 26.7% | 4.4% |
| Maximum | 88.0% | 100.0% |
| Range | 61.3% | 95.6% |
| Mean | 49.2% | 53.1% |
| Median | 45.9% | 47.9% |
| Interquartile 25% (IQ1) | 40.9% | 44.1% |
| Interquartile 75% (IQ3) | 50.6% | 59.7% |
| Interquartile Range (IQR) | 9.7% | 15.6% |
| Standard Deviation (Sample) | 16.1% | 20.5% |
| Standard Deviation (Population) | 15.6% | 20.4% |
Demographics Similar to Immigrants from Uruguay and Danes by Disability Age Over 75
In terms of disability age over 75, the demographic groups most similar to Immigrants from Uruguay are Immigrants from Kuwait (46.4%, a difference of 0.030%), Immigrants from Cameroon (46.4%, a difference of 0.050%), Israeli (46.4%, a difference of 0.070%), Immigrants from Malaysia (46.4%, a difference of 0.090%), and Ukrainian (46.4%, a difference of 0.090%). Similarly, the demographic groups most similar to Danes are Uruguayan (46.2%, a difference of 0.080%), Immigrants from Saudi Arabia (46.3%, a difference of 0.10%), Northern European (46.3%, a difference of 0.11%), Immigrants from Egypt (46.3%, a difference of 0.12%), and German (46.3%, a difference of 0.16%).
| Demographics | Rating | Rank | Disability Age Over 75 |
| Danes | 98.6 /100 | #87 | Exceptional 46.2% |
| Uruguayans | 98.4 /100 | #88 | Exceptional 46.2% |
| Immigrants | Saudi Arabia | 98.4 /100 | #89 | Exceptional 46.3% |
| Northern Europeans | 98.3 /100 | #90 | Exceptional 46.3% |
| Immigrants | Egypt | 98.3 /100 | #91 | Exceptional 46.3% |
| Germans | 98.2 /100 | #92 | Exceptional 46.3% |
| Ugandans | 98.2 /100 | #93 | Exceptional 46.3% |
| Albanians | 98.1 /100 | #94 | Exceptional 46.3% |
| Immigrants | Brazil | 98.0 /100 | #95 | Exceptional 46.3% |
| Immigrants | China | 98.0 /100 | #96 | Exceptional 46.3% |
| Finns | 97.9 /100 | #97 | Exceptional 46.3% |
| Immigrants | Japan | 97.8 /100 | #98 | Exceptional 46.3% |
| Palestinians | 97.7 /100 | #99 | Exceptional 46.3% |
| Immigrants | Eastern Europe | 97.7 /100 | #100 | Exceptional 46.3% |
| Mongolians | 97.7 /100 | #101 | Exceptional 46.3% |
| Immigrants | Malaysia | 97.1 /100 | #102 | Exceptional 46.4% |
| Ukrainians | 97.1 /100 | #103 | Exceptional 46.4% |
| Israelis | 97.0 /100 | #104 | Exceptional 46.4% |
| Immigrants | Cameroon | 96.9 /100 | #105 | Exceptional 46.4% |
| Immigrants | Kuwait | 96.8 /100 | #106 | Exceptional 46.4% |
| Immigrants | Uruguay | 96.7 /100 | #107 | Exceptional 46.4% |