Immigrants from Ukraine vs Spanish American Ambulatory Disability
COMPARE
Immigrants from Ukraine
Spanish American
Ambulatory Disability
Ambulatory Disability Comparison
Immigrants from Ukraine
Spanish Americans
6.2%
AMBULATORY DISABILITY
18.4/ 100
METRIC RATING
203rd/ 347
METRIC RANK
7.1%
AMBULATORY DISABILITY
0.0/ 100
METRIC RATING
307th/ 347
METRIC RANK
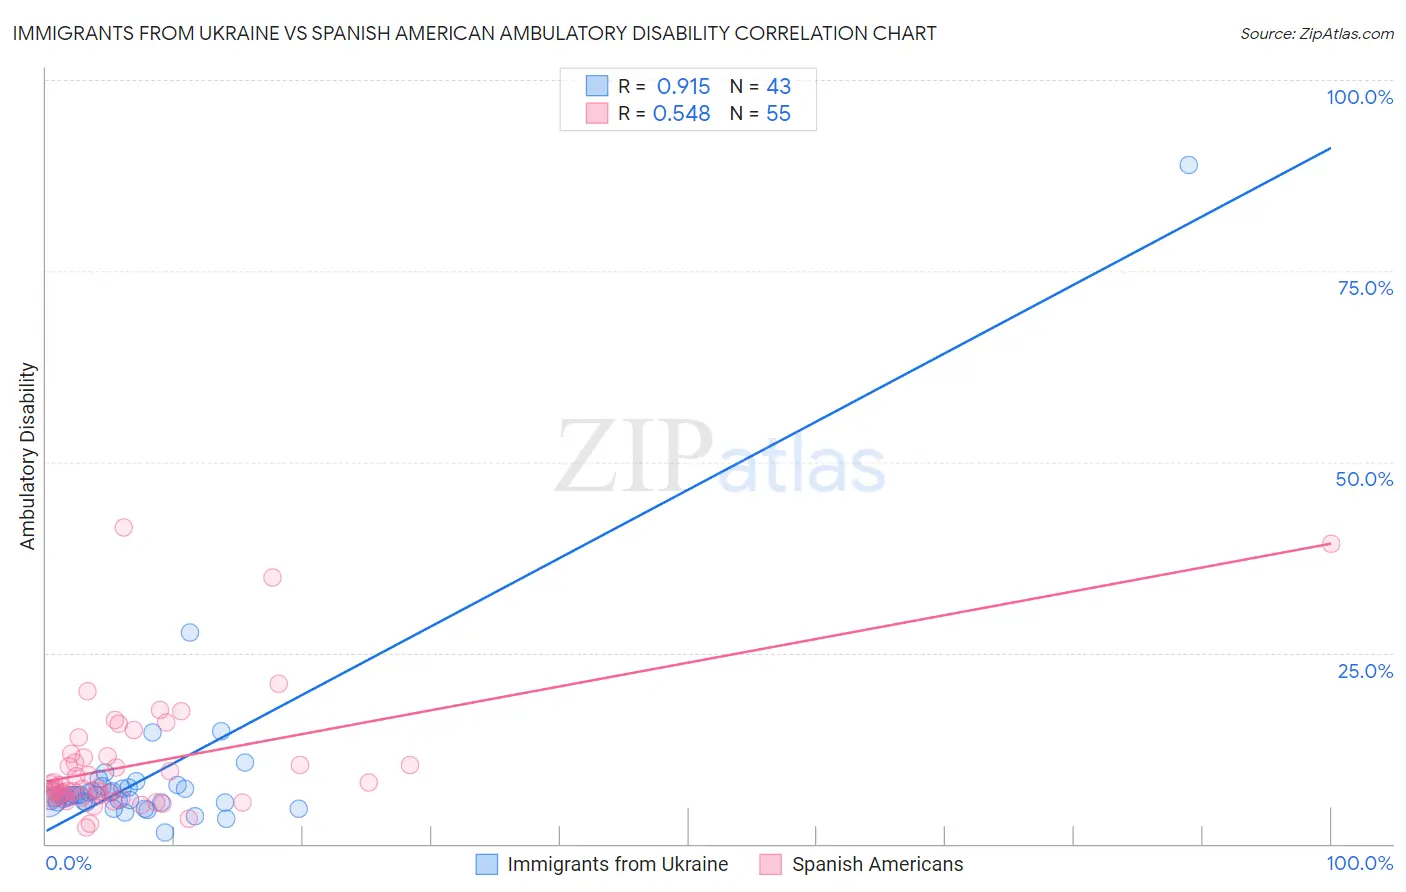
Immigrants from Ukraine vs Spanish American Ambulatory Disability Correlation Chart
The statistical analysis conducted on geographies consisting of 289,659,329 people shows a near-perfect positive correlation between the proportion of Immigrants from Ukraine and percentage of population with ambulatory disability in the United States with a correlation coefficient (R) of 0.915 and weighted average of 6.2%. Similarly, the statistical analysis conducted on geographies consisting of 103,166,807 people shows a substantial positive correlation between the proportion of Spanish Americans and percentage of population with ambulatory disability in the United States with a correlation coefficient (R) of 0.548 and weighted average of 7.1%, a difference of 13.3%.
Ambulatory Disability Correlation Summary
| Measurement | Immigrants from Ukraine | Spanish American |
| Minimum | 1.5% | 2.1% |
| Maximum | 88.9% | 41.5% |
| Range | 87.4% | 39.4% |
| Mean | 8.9% | 10.5% |
| Median | 6.3% | 7.3% |
| Interquartile 25% (IQ1) | 5.5% | 6.1% |
| Interquartile 75% (IQ3) | 7.3% | 11.5% |
| Interquartile Range (IQR) | 1.9% | 5.4% |
| Standard Deviation (Sample) | 13.1% | 8.0% |
| Standard Deviation (Population) | 13.0% | 8.0% |
Similar Demographics by Ambulatory Disability
Demographics Similar to Immigrants from Ukraine by Ambulatory Disability
In terms of ambulatory disability, the demographic groups most similar to Immigrants from Ukraine are Immigrants from Congo (6.2%, a difference of 0.010%), Slovene (6.2%, a difference of 0.030%), Finnish (6.2%, a difference of 0.10%), Albanian (6.2%, a difference of 0.11%), and Immigrants from Central America (6.2%, a difference of 0.14%).
| Demographics | Rating | Rank | Ambulatory Disability |
| Malaysians | 28.2 /100 | #196 | Fair 6.2% |
| Poles | 26.3 /100 | #197 | Fair 6.2% |
| Immigrants | Bangladesh | 24.6 /100 | #198 | Fair 6.2% |
| Italians | 22.6 /100 | #199 | Fair 6.2% |
| Immigrants | Cambodia | 21.5 /100 | #200 | Fair 6.2% |
| Immigrants | Central America | 20.1 /100 | #201 | Fair 6.2% |
| Albanians | 19.7 /100 | #202 | Poor 6.2% |
| Immigrants | Ukraine | 18.4 /100 | #203 | Poor 6.2% |
| Immigrants | Congo | 18.2 /100 | #204 | Poor 6.2% |
| Slovenes | 18.0 /100 | #205 | Poor 6.2% |
| Finns | 17.2 /100 | #206 | Poor 6.2% |
| Alsatians | 15.1 /100 | #207 | Poor 6.3% |
| Bangladeshis | 14.2 /100 | #208 | Poor 6.3% |
| Immigrants | Iraq | 14.0 /100 | #209 | Poor 6.3% |
| Immigrants | Laos | 13.2 /100 | #210 | Poor 6.3% |
Demographics Similar to Spanish Americans by Ambulatory Disability
In terms of ambulatory disability, the demographic groups most similar to Spanish Americans are Chippewa (7.1%, a difference of 0.0%), Immigrants from the Azores (7.1%, a difference of 0.17%), Iroquois (7.1%, a difference of 0.26%), Arapaho (7.1%, a difference of 0.45%), and Cree (7.1%, a difference of 0.46%).
| Demographics | Rating | Rank | Ambulatory Disability |
| Marshallese | 0.0 /100 | #300 | Tragic 6.9% |
| British West Indians | 0.0 /100 | #301 | Tragic 7.0% |
| Immigrants | Armenia | 0.0 /100 | #302 | Tragic 7.0% |
| Africans | 0.0 /100 | #303 | Tragic 7.0% |
| Immigrants | Cabo Verde | 0.0 /100 | #304 | Tragic 7.0% |
| Immigrants | Micronesia | 0.0 /100 | #305 | Tragic 7.0% |
| Iroquois | 0.0 /100 | #306 | Tragic 7.1% |
| Spanish Americans | 0.0 /100 | #307 | Tragic 7.1% |
| Chippewa | 0.0 /100 | #308 | Tragic 7.1% |
| Immigrants | Azores | 0.0 /100 | #309 | Tragic 7.1% |
| Arapaho | 0.0 /100 | #310 | Tragic 7.1% |
| Cree | 0.0 /100 | #311 | Tragic 7.1% |
| Delaware | 0.0 /100 | #312 | Tragic 7.1% |
| Immigrants | Yemen | 0.0 /100 | #313 | Tragic 7.1% |
| Blackfeet | 0.0 /100 | #314 | Tragic 7.1% |