Immigrants from Ukraine vs Immigrants from Thailand Ambulatory Disability
COMPARE
Immigrants from Ukraine
Immigrants from Thailand
Ambulatory Disability
Ambulatory Disability Comparison
Immigrants from Ukraine
Immigrants from Thailand
6.2%
AMBULATORY DISABILITY
18.4/ 100
METRIC RATING
203rd/ 347
METRIC RANK
6.1%
AMBULATORY DISABILITY
42.2/ 100
METRIC RATING
183rd/ 347
METRIC RANK
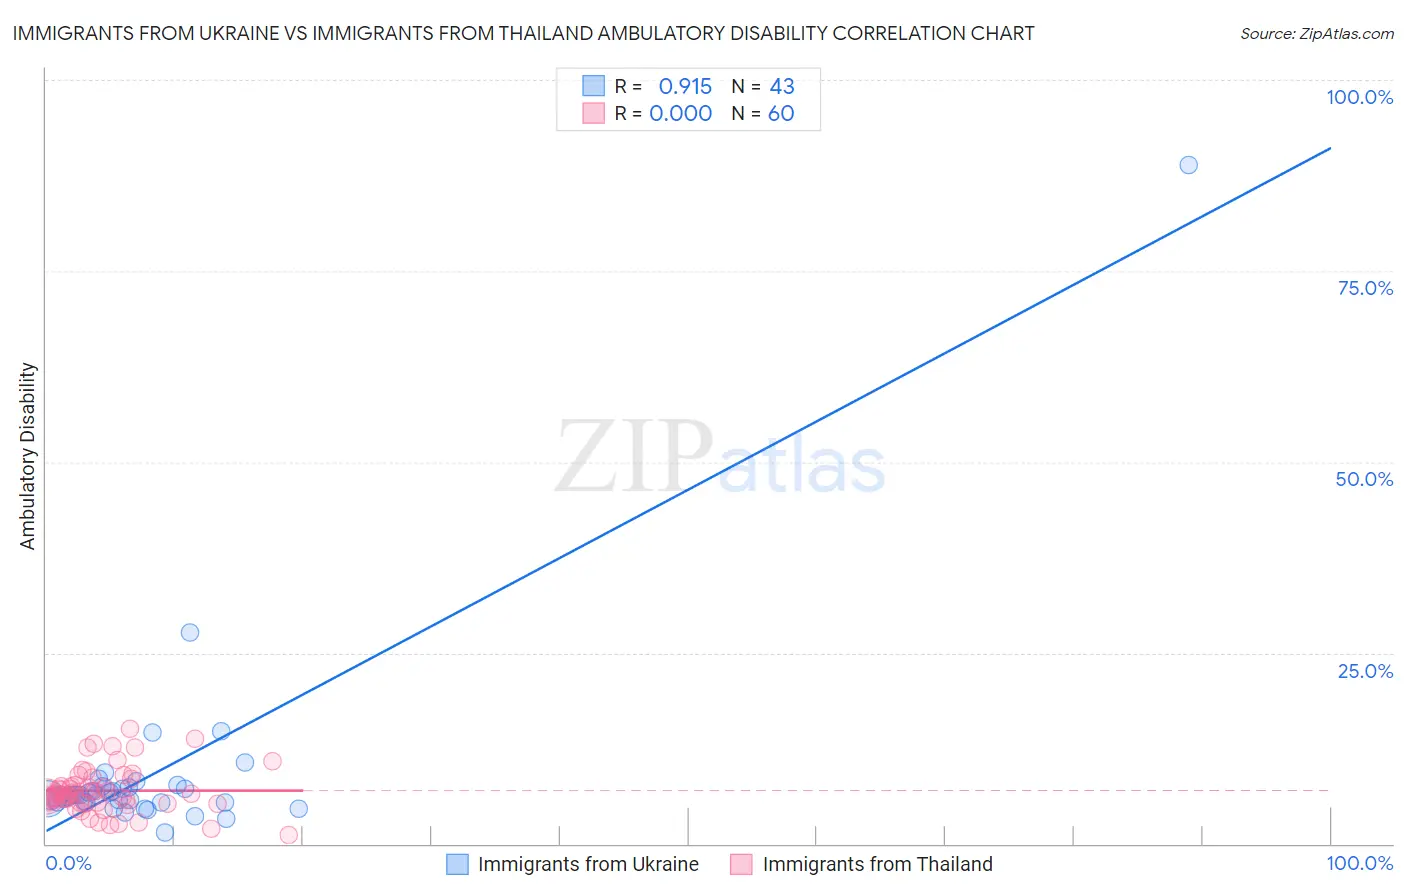
Immigrants from Ukraine vs Immigrants from Thailand Ambulatory Disability Correlation Chart
The statistical analysis conducted on geographies consisting of 289,659,329 people shows a near-perfect positive correlation between the proportion of Immigrants from Ukraine and percentage of population with ambulatory disability in the United States with a correlation coefficient (R) of 0.915 and weighted average of 6.2%. Similarly, the statistical analysis conducted on geographies consisting of 316,957,387 people shows no correlation between the proportion of Immigrants from Thailand and percentage of population with ambulatory disability in the United States with a correlation coefficient (R) of 0.000 and weighted average of 6.1%, a difference of 1.5%.
Ambulatory Disability Correlation Summary
| Measurement | Immigrants from Ukraine | Immigrants from Thailand |
| Minimum | 1.5% | 1.1% |
| Maximum | 88.9% | 15.0% |
| Range | 87.4% | 13.9% |
| Mean | 8.9% | 7.0% |
| Median | 6.3% | 6.5% |
| Interquartile 25% (IQ1) | 5.5% | 5.4% |
| Interquartile 75% (IQ3) | 7.3% | 8.0% |
| Interquartile Range (IQR) | 1.9% | 2.6% |
| Standard Deviation (Sample) | 13.1% | 2.9% |
| Standard Deviation (Population) | 13.0% | 2.9% |
Demographics Similar to Immigrants from Ukraine and Immigrants from Thailand by Ambulatory Disability
In terms of ambulatory disability, the demographic groups most similar to Immigrants from Ukraine are Albanian (6.2%, a difference of 0.11%), Immigrants from Central America (6.2%, a difference of 0.14%), Immigrants from Cambodia (6.2%, a difference of 0.25%), Italian (6.2%, a difference of 0.34%), and Immigrants from Bangladesh (6.2%, a difference of 0.48%). Similarly, the demographic groups most similar to Immigrants from Thailand are Immigrants from Ghana (6.1%, a difference of 0.050%), Immigrants from Bosnia and Herzegovina (6.2%, a difference of 0.27%), European (6.2%, a difference of 0.33%), Carpatho Rusyn (6.2%, a difference of 0.38%), and British (6.2%, a difference of 0.45%).
| Demographics | Rating | Rank | Ambulatory Disability |
| Immigrants | Thailand | 42.2 /100 | #183 | Average 6.1% |
| Immigrants | Ghana | 41.2 /100 | #184 | Average 6.1% |
| Immigrants | Bosnia and Herzegovina | 37.2 /100 | #185 | Fair 6.2% |
| Europeans | 36.2 /100 | #186 | Fair 6.2% |
| Carpatho Rusyns | 35.3 /100 | #187 | Fair 6.2% |
| British | 34.3 /100 | #188 | Fair 6.2% |
| Ukrainians | 34.0 /100 | #189 | Fair 6.2% |
| Immigrants | Western Africa | 33.4 /100 | #190 | Fair 6.2% |
| Immigrants | Guatemala | 31.9 /100 | #191 | Fair 6.2% |
| Immigrants | Western Europe | 31.6 /100 | #192 | Fair 6.2% |
| Guatemalans | 30.0 /100 | #193 | Fair 6.2% |
| Alaska Natives | 29.8 /100 | #194 | Fair 6.2% |
| Belgians | 28.6 /100 | #195 | Fair 6.2% |
| Malaysians | 28.2 /100 | #196 | Fair 6.2% |
| Poles | 26.3 /100 | #197 | Fair 6.2% |
| Immigrants | Bangladesh | 24.6 /100 | #198 | Fair 6.2% |
| Italians | 22.6 /100 | #199 | Fair 6.2% |
| Immigrants | Cambodia | 21.5 /100 | #200 | Fair 6.2% |
| Immigrants | Central America | 20.1 /100 | #201 | Fair 6.2% |
| Albanians | 19.7 /100 | #202 | Poor 6.2% |
| Immigrants | Ukraine | 18.4 /100 | #203 | Poor 6.2% |