Immigrants from Uganda vs Pueblo Male Disability
COMPARE
Immigrants from Uganda
Pueblo
Male Disability
Male Disability Comparison
Immigrants from Uganda
Pueblo
10.8%
MALE DISABILITY
94.0/ 100
METRIC RATING
109th/ 347
METRIC RANK
15.0%
MALE DISABILITY
0.0/ 100
METRIC RATING
338th/ 347
METRIC RANK
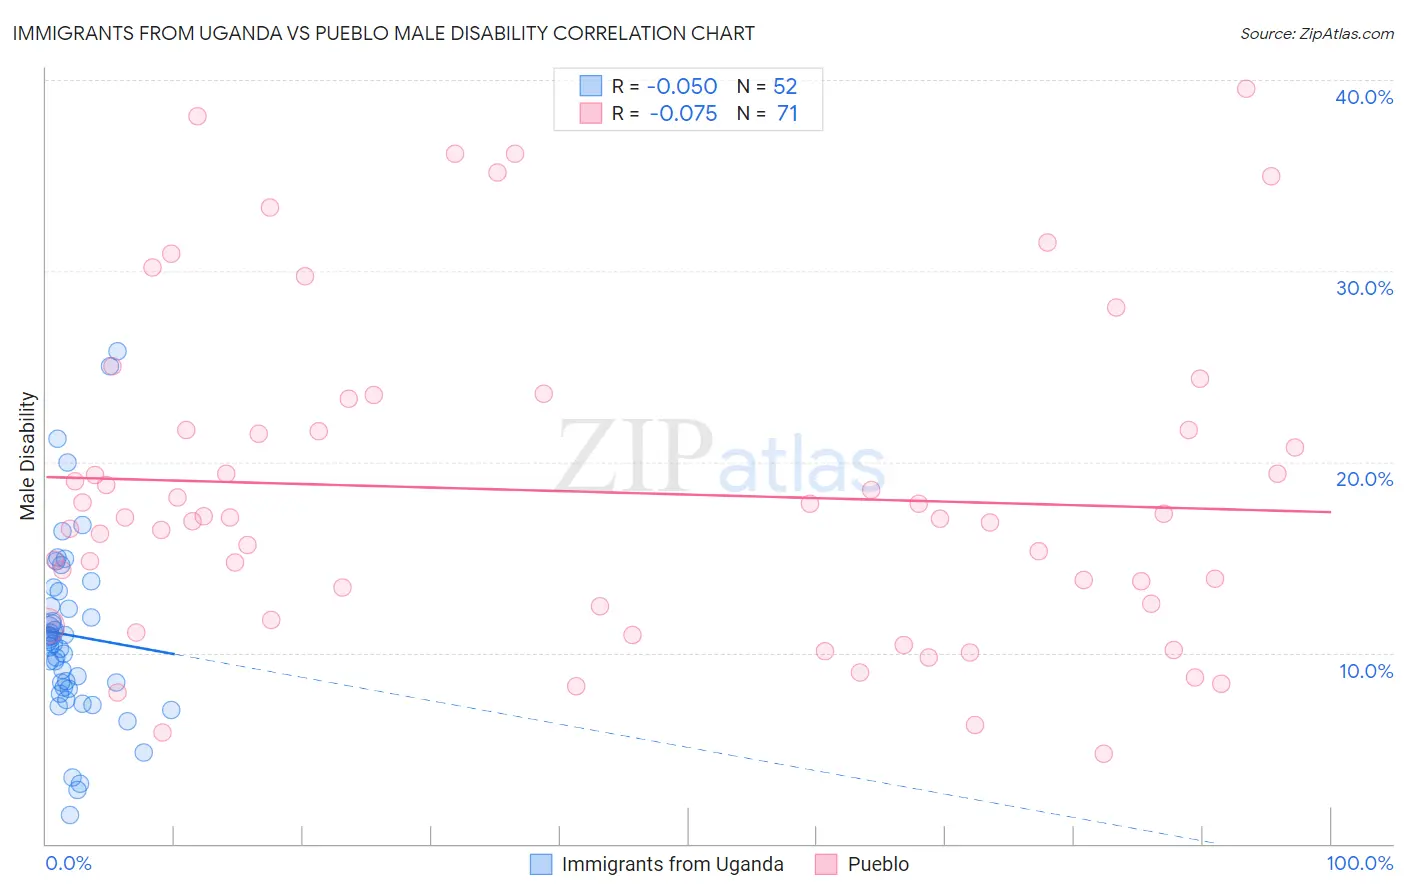
Immigrants from Uganda vs Pueblo Male Disability Correlation Chart
The statistical analysis conducted on geographies consisting of 125,978,860 people shows a slight negative correlation between the proportion of Immigrants from Uganda and percentage of males with a disability in the United States with a correlation coefficient (R) of -0.050 and weighted average of 10.8%. Similarly, the statistical analysis conducted on geographies consisting of 120,077,979 people shows a slight negative correlation between the proportion of Pueblo and percentage of males with a disability in the United States with a correlation coefficient (R) of -0.075 and weighted average of 15.0%, a difference of 39.0%.
Male Disability Correlation Summary
| Measurement | Immigrants from Uganda | Pueblo |
| Minimum | 1.5% | 4.7% |
| Maximum | 25.8% | 39.5% |
| Range | 24.3% | 34.8% |
| Mean | 10.9% | 18.4% |
| Median | 10.5% | 17.1% |
| Interquartile 25% (IQ1) | 8.2% | 12.4% |
| Interquartile 75% (IQ3) | 12.8% | 21.7% |
| Interquartile Range (IQR) | 4.7% | 9.2% |
| Standard Deviation (Sample) | 4.9% | 8.4% |
| Standard Deviation (Population) | 4.8% | 8.3% |
Similar Demographics by Male Disability
Demographics Similar to Immigrants from Uganda by Male Disability
In terms of male disability, the demographic groups most similar to Immigrants from Uganda are Immigrants (10.8%, a difference of 0.030%), Immigrants from Belgium (10.8%, a difference of 0.050%), Immigrants from Uruguay (10.8%, a difference of 0.060%), Immigrants from Eastern Africa (10.8%, a difference of 0.070%), and Ghanaian (10.8%, a difference of 0.16%).
| Demographics | Rating | Rank | Male Disability |
| Immigrants | Eastern Europe | 95.3 /100 | #102 | Exceptional 10.7% |
| Uruguayans | 95.3 /100 | #103 | Exceptional 10.7% |
| Immigrants | Nigeria | 95.1 /100 | #104 | Exceptional 10.8% |
| Immigrants | Brazil | 95.0 /100 | #105 | Exceptional 10.8% |
| Immigrants | Syria | 94.9 /100 | #106 | Exceptional 10.8% |
| Immigrants | Eastern Africa | 94.3 /100 | #107 | Exceptional 10.8% |
| Immigrants | Belgium | 94.2 /100 | #108 | Exceptional 10.8% |
| Immigrants | Uganda | 94.0 /100 | #109 | Exceptional 10.8% |
| Immigrants | Immigrants | 93.9 /100 | #110 | Exceptional 10.8% |
| Immigrants | Uruguay | 93.8 /100 | #111 | Exceptional 10.8% |
| Ghanaians | 93.4 /100 | #112 | Exceptional 10.8% |
| Immigrants | Zimbabwe | 93.0 /100 | #113 | Exceptional 10.8% |
| Central Americans | 92.7 /100 | #114 | Exceptional 10.8% |
| Immigrants | Barbados | 92.2 /100 | #115 | Exceptional 10.8% |
| Immigrants | South Africa | 91.8 /100 | #116 | Exceptional 10.8% |
Demographics Similar to Pueblo by Male Disability
In terms of male disability, the demographic groups most similar to Pueblo are Menominee (15.0%, a difference of 0.11%), Alaskan Athabascan (14.9%, a difference of 0.62%), Chickasaw (15.1%, a difference of 0.80%), Dutch West Indian (14.8%, a difference of 1.1%), and Cherokee (14.8%, a difference of 1.1%).
| Demographics | Rating | Rank | Male Disability |
| Tohono O'odham | 0.0 /100 | #331 | Tragic 14.6% |
| Seminole | 0.0 /100 | #332 | Tragic 14.7% |
| Yuman | 0.0 /100 | #333 | Tragic 14.7% |
| Cherokee | 0.0 /100 | #334 | Tragic 14.8% |
| Dutch West Indians | 0.0 /100 | #335 | Tragic 14.8% |
| Alaskan Athabascans | 0.0 /100 | #336 | Tragic 14.9% |
| Menominee | 0.0 /100 | #337 | Tragic 15.0% |
| Pueblo | 0.0 /100 | #338 | Tragic 15.0% |
| Chickasaw | 0.0 /100 | #339 | Tragic 15.1% |
| Lumbee | 0.0 /100 | #340 | Tragic 15.2% |
| Choctaw | 0.0 /100 | #341 | Tragic 15.4% |
| Kiowa | 0.0 /100 | #342 | Tragic 15.4% |
| Creek | 0.0 /100 | #343 | Tragic 15.5% |
| Puerto Ricans | 0.0 /100 | #344 | Tragic 15.6% |
| Tsimshian | 0.0 /100 | #345 | Tragic 15.6% |