Immigrants from Turkey vs Nepalese Hearing Disability
COMPARE
Immigrants from Turkey
Nepalese
Hearing Disability
Hearing Disability Comparison
Immigrants from Turkey
Nepalese
2.8%
HEARING DISABILITY
96.7/ 100
METRIC RATING
88th/ 347
METRIC RANK
3.3%
HEARING DISABILITY
1.2/ 100
METRIC RATING
239th/ 347
METRIC RANK
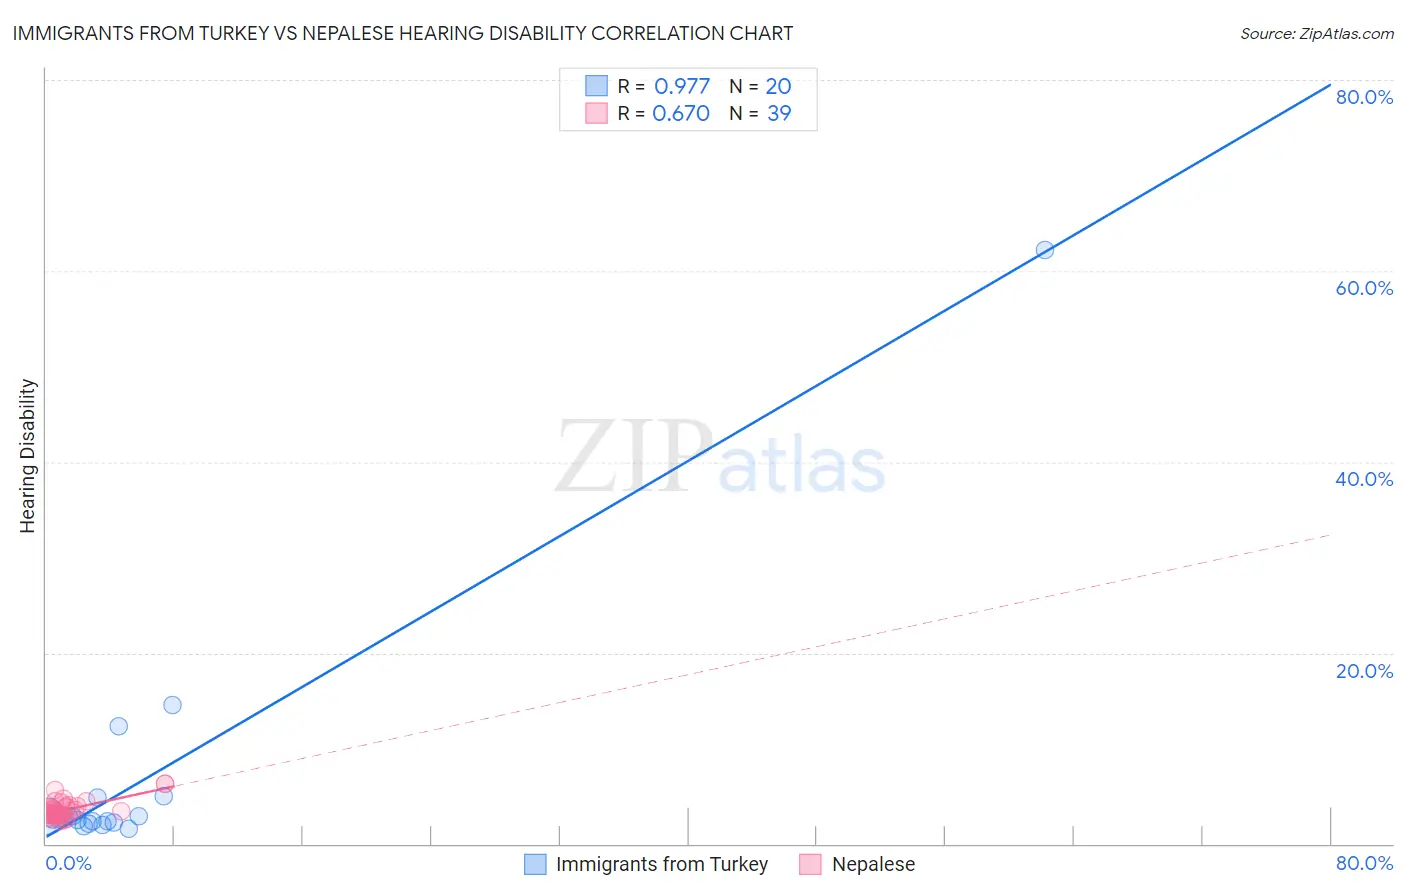
Immigrants from Turkey vs Nepalese Hearing Disability Correlation Chart
The statistical analysis conducted on geographies consisting of 223,029,530 people shows a perfect positive correlation between the proportion of Immigrants from Turkey and percentage of population with hearing disability in the United States with a correlation coefficient (R) of 0.977 and weighted average of 2.8%. Similarly, the statistical analysis conducted on geographies consisting of 24,517,800 people shows a significant positive correlation between the proportion of Nepalese and percentage of population with hearing disability in the United States with a correlation coefficient (R) of 0.670 and weighted average of 3.3%, a difference of 19.8%.
Hearing Disability Correlation Summary
| Measurement | Immigrants from Turkey | Nepalese |
| Minimum | 1.5% | 2.4% |
| Maximum | 62.2% | 6.3% |
| Range | 60.6% | 3.9% |
| Mean | 6.8% | 3.5% |
| Median | 2.7% | 3.3% |
| Interquartile 25% (IQ1) | 2.3% | 3.0% |
| Interquartile 75% (IQ3) | 3.9% | 3.9% |
| Interquartile Range (IQR) | 1.5% | 0.90% |
| Standard Deviation (Sample) | 13.5% | 0.92% |
| Standard Deviation (Population) | 13.1% | 0.91% |
Similar Demographics by Hearing Disability
Demographics Similar to Immigrants from Turkey by Hearing Disability
In terms of hearing disability, the demographic groups most similar to Immigrants from Turkey are Belizean (2.8%, a difference of 0.030%), Somali (2.8%, a difference of 0.040%), Immigrants from Morocco (2.8%, a difference of 0.050%), Immigrants from Middle Africa (2.8%, a difference of 0.13%), and Immigrants from Iran (2.8%, a difference of 0.14%).
| Demographics | Rating | Rank | Hearing Disability |
| Immigrants | Uruguay | 97.2 /100 | #81 | Exceptional 2.7% |
| Immigrants | Armenia | 97.2 /100 | #82 | Exceptional 2.7% |
| Immigrants | Cuba | 97.2 /100 | #83 | Exceptional 2.7% |
| Immigrants | Argentina | 97.0 /100 | #84 | Exceptional 2.8% |
| Immigrants | Northern Africa | 96.9 /100 | #85 | Exceptional 2.8% |
| Immigrants | Iran | 96.8 /100 | #86 | Exceptional 2.8% |
| Somalis | 96.7 /100 | #87 | Exceptional 2.8% |
| Immigrants | Turkey | 96.7 /100 | #88 | Exceptional 2.8% |
| Belizeans | 96.6 /100 | #89 | Exceptional 2.8% |
| Immigrants | Morocco | 96.6 /100 | #90 | Exceptional 2.8% |
| Immigrants | Middle Africa | 96.5 /100 | #91 | Exceptional 2.8% |
| Iranians | 96.4 /100 | #92 | Exceptional 2.8% |
| Immigrants | Kuwait | 96.3 /100 | #93 | Exceptional 2.8% |
| Uruguayans | 95.9 /100 | #94 | Exceptional 2.8% |
| Israelis | 95.9 /100 | #95 | Exceptional 2.8% |
Demographics Similar to Nepalese by Hearing Disability
In terms of hearing disability, the demographic groups most similar to Nepalese are Immigrants from Netherlands (3.3%, a difference of 0.18%), Samoan (3.3%, a difference of 0.25%), Yugoslavian (3.3%, a difference of 0.36%), Immigrants from Western Europe (3.3%, a difference of 0.53%), and Assyrian/Chaldean/Syriac (3.3%, a difference of 0.60%).
| Demographics | Rating | Rank | Hearing Disability |
| Ukrainians | 2.9 /100 | #232 | Tragic 3.2% |
| Estonians | 2.4 /100 | #233 | Tragic 3.3% |
| Central American Indians | 2.3 /100 | #234 | Tragic 3.3% |
| Guamanians/Chamorros | 2.2 /100 | #235 | Tragic 3.3% |
| Serbians | 2.2 /100 | #236 | Tragic 3.3% |
| Immigrants | Austria | 1.8 /100 | #237 | Tragic 3.3% |
| German Russians | 1.8 /100 | #238 | Tragic 3.3% |
| Nepalese | 1.2 /100 | #239 | Tragic 3.3% |
| Immigrants | Netherlands | 1.1 /100 | #240 | Tragic 3.3% |
| Samoans | 1.1 /100 | #241 | Tragic 3.3% |
| Yugoslavians | 1.0 /100 | #242 | Tragic 3.3% |
| Immigrants | Western Europe | 1.0 /100 | #243 | Tragic 3.3% |
| Assyrians/Chaldeans/Syriacs | 0.9 /100 | #244 | Tragic 3.3% |
| Immigrants | Scotland | 0.8 /100 | #245 | Tragic 3.3% |
| Immigrants | England | 0.7 /100 | #246 | Tragic 3.3% |