Immigrants from Cuba vs Nepalese Hearing Disability
COMPARE
Immigrants from Cuba
Nepalese
Hearing Disability
Hearing Disability Comparison
Immigrants from Cuba
Nepalese
2.7%
HEARING DISABILITY
97.2/ 100
METRIC RATING
83rd/ 347
METRIC RANK
3.3%
HEARING DISABILITY
1.2/ 100
METRIC RATING
239th/ 347
METRIC RANK
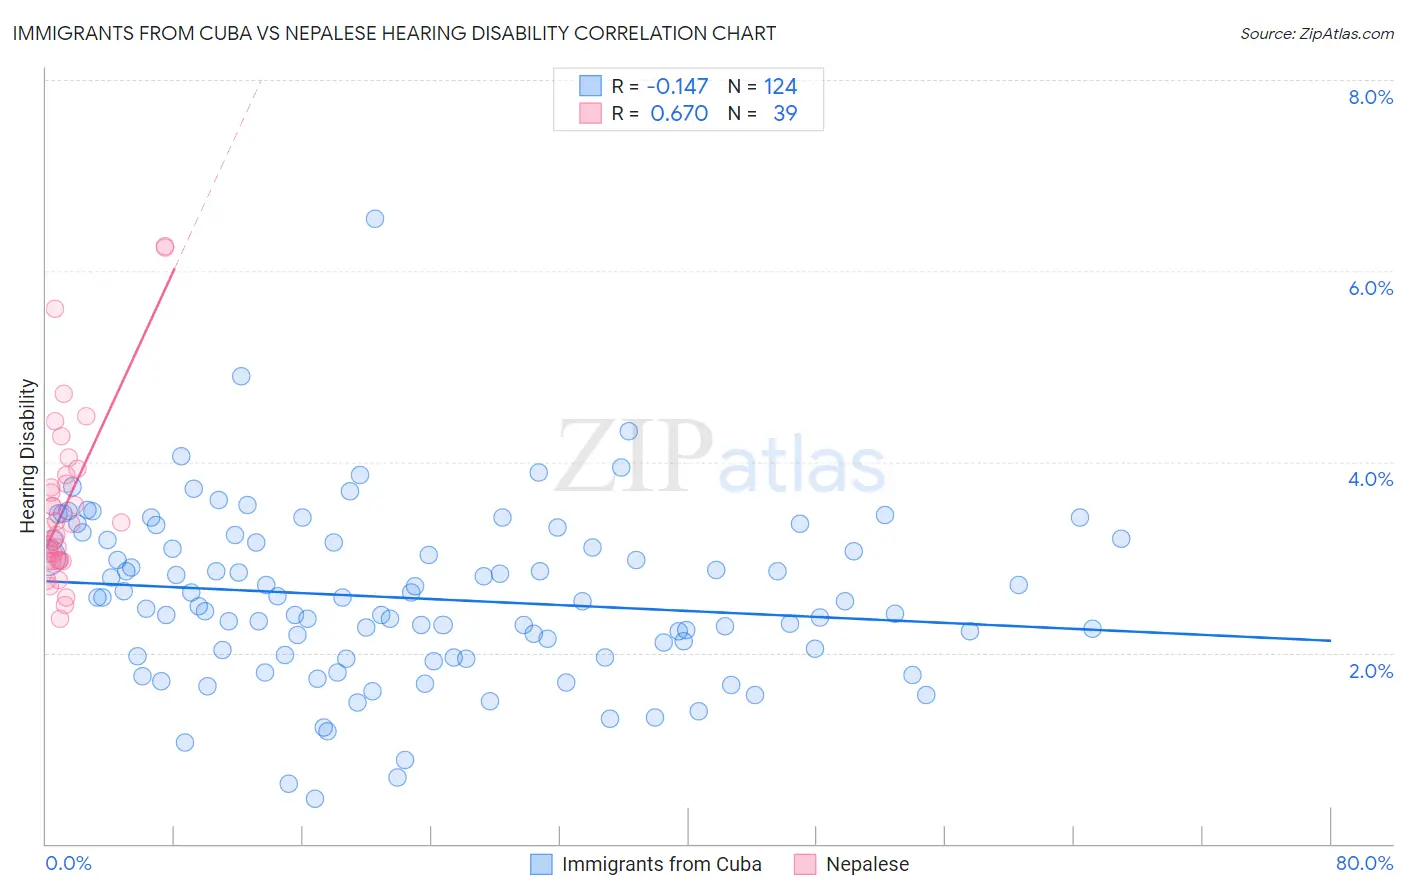
Immigrants from Cuba vs Nepalese Hearing Disability Correlation Chart
The statistical analysis conducted on geographies consisting of 325,940,819 people shows a poor negative correlation between the proportion of Immigrants from Cuba and percentage of population with hearing disability in the United States with a correlation coefficient (R) of -0.147 and weighted average of 2.7%. Similarly, the statistical analysis conducted on geographies consisting of 24,517,800 people shows a significant positive correlation between the proportion of Nepalese and percentage of population with hearing disability in the United States with a correlation coefficient (R) of 0.670 and weighted average of 3.3%, a difference of 20.3%.
Hearing Disability Correlation Summary
| Measurement | Immigrants from Cuba | Nepalese |
| Minimum | 0.47% | 2.4% |
| Maximum | 6.5% | 6.3% |
| Range | 6.1% | 3.9% |
| Mean | 2.6% | 3.5% |
| Median | 2.5% | 3.3% |
| Interquartile 25% (IQ1) | 2.0% | 3.0% |
| Interquartile 75% (IQ3) | 3.2% | 3.9% |
| Interquartile Range (IQR) | 1.2% | 0.90% |
| Standard Deviation (Sample) | 0.88% | 0.92% |
| Standard Deviation (Population) | 0.88% | 0.91% |
Similar Demographics by Hearing Disability
Demographics Similar to Immigrants from Cuba by Hearing Disability
In terms of hearing disability, the demographic groups most similar to Immigrants from Cuba are Immigrants from Armenia (2.7%, a difference of 0.020%), Immigrants from Uruguay (2.7%, a difference of 0.030%), Immigrants from Asia (2.7%, a difference of 0.060%), Immigrants from Argentina (2.8%, a difference of 0.19%), and Colombian (2.7%, a difference of 0.25%).
| Demographics | Rating | Rank | Hearing Disability |
| Asians | 97.5 /100 | #76 | Exceptional 2.7% |
| Immigrants | Malaysia | 97.5 /100 | #77 | Exceptional 2.7% |
| Mongolians | 97.4 /100 | #78 | Exceptional 2.7% |
| Colombians | 97.4 /100 | #79 | Exceptional 2.7% |
| Immigrants | Asia | 97.2 /100 | #80 | Exceptional 2.7% |
| Immigrants | Uruguay | 97.2 /100 | #81 | Exceptional 2.7% |
| Immigrants | Armenia | 97.2 /100 | #82 | Exceptional 2.7% |
| Immigrants | Cuba | 97.2 /100 | #83 | Exceptional 2.7% |
| Immigrants | Argentina | 97.0 /100 | #84 | Exceptional 2.8% |
| Immigrants | Northern Africa | 96.9 /100 | #85 | Exceptional 2.8% |
| Immigrants | Iran | 96.8 /100 | #86 | Exceptional 2.8% |
| Somalis | 96.7 /100 | #87 | Exceptional 2.8% |
| Immigrants | Turkey | 96.7 /100 | #88 | Exceptional 2.8% |
| Belizeans | 96.6 /100 | #89 | Exceptional 2.8% |
| Immigrants | Morocco | 96.6 /100 | #90 | Exceptional 2.8% |
Demographics Similar to Nepalese by Hearing Disability
In terms of hearing disability, the demographic groups most similar to Nepalese are Immigrants from Netherlands (3.3%, a difference of 0.18%), Samoan (3.3%, a difference of 0.25%), Yugoslavian (3.3%, a difference of 0.36%), Immigrants from Western Europe (3.3%, a difference of 0.53%), and Assyrian/Chaldean/Syriac (3.3%, a difference of 0.60%).
| Demographics | Rating | Rank | Hearing Disability |
| Ukrainians | 2.9 /100 | #232 | Tragic 3.2% |
| Estonians | 2.4 /100 | #233 | Tragic 3.3% |
| Central American Indians | 2.3 /100 | #234 | Tragic 3.3% |
| Guamanians/Chamorros | 2.2 /100 | #235 | Tragic 3.3% |
| Serbians | 2.2 /100 | #236 | Tragic 3.3% |
| Immigrants | Austria | 1.8 /100 | #237 | Tragic 3.3% |
| German Russians | 1.8 /100 | #238 | Tragic 3.3% |
| Nepalese | 1.2 /100 | #239 | Tragic 3.3% |
| Immigrants | Netherlands | 1.1 /100 | #240 | Tragic 3.3% |
| Samoans | 1.1 /100 | #241 | Tragic 3.3% |
| Yugoslavians | 1.0 /100 | #242 | Tragic 3.3% |
| Immigrants | Western Europe | 1.0 /100 | #243 | Tragic 3.3% |
| Assyrians/Chaldeans/Syriacs | 0.9 /100 | #244 | Tragic 3.3% |
| Immigrants | Scotland | 0.8 /100 | #245 | Tragic 3.3% |
| Immigrants | England | 0.7 /100 | #246 | Tragic 3.3% |