Immigrants from Trinidad and Tobago vs Immigrants from Oceania Disability
COMPARE
Immigrants from Trinidad and Tobago
Immigrants from Oceania
Disability
Disability Comparison
Immigrants from Trinidad and Tobago
Immigrants from Oceania
11.7%
DISABILITY
58.9/ 100
METRIC RATING
163rd/ 347
METRIC RANK
11.8%
DISABILITY
34.3/ 100
METRIC RATING
181st/ 347
METRIC RANK
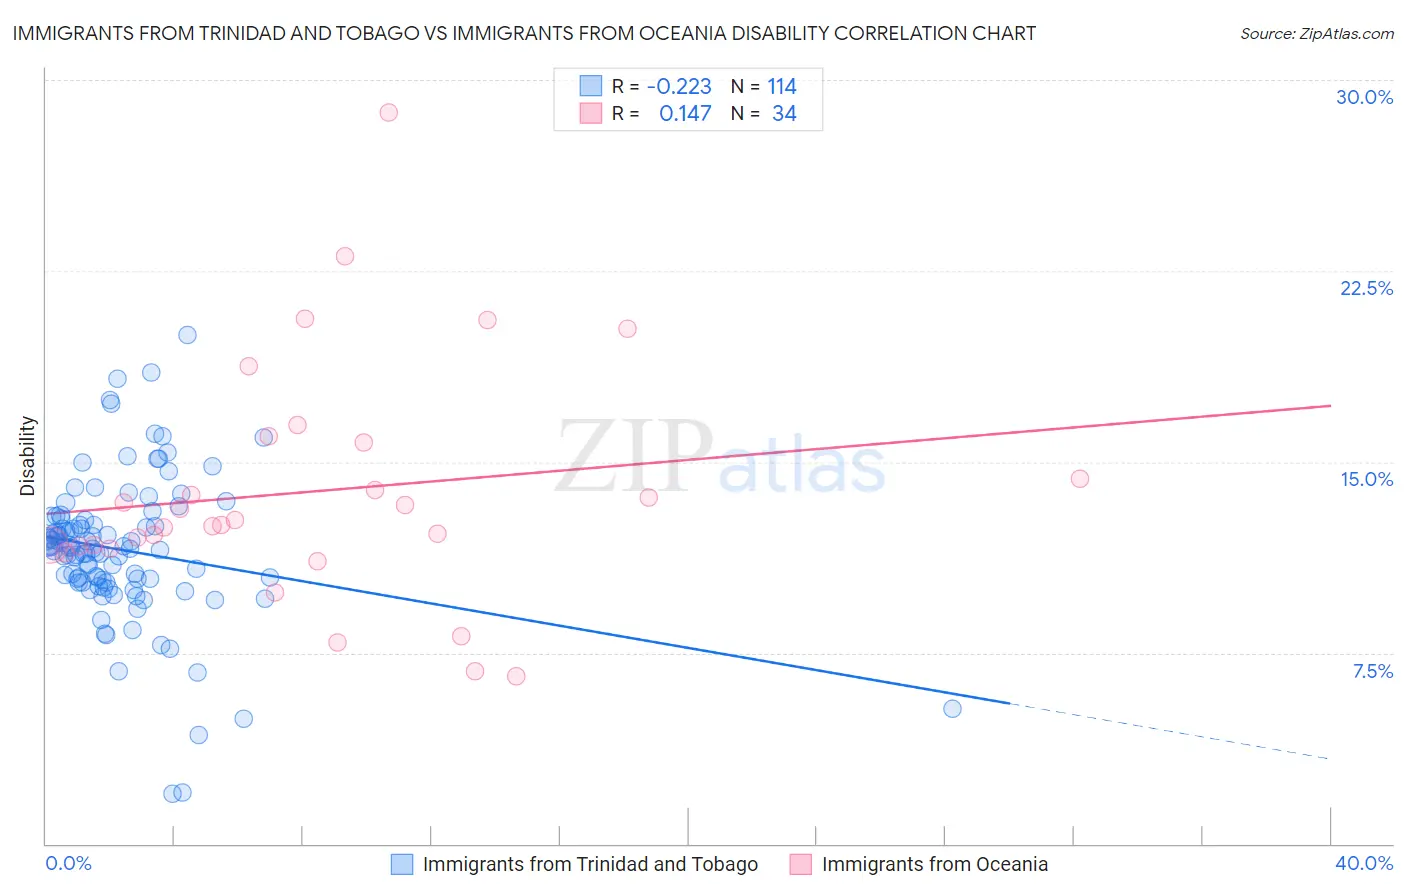
Immigrants from Trinidad and Tobago vs Immigrants from Oceania Disability Correlation Chart
The statistical analysis conducted on geographies consisting of 223,506,024 people shows a weak negative correlation between the proportion of Immigrants from Trinidad and Tobago and percentage of population with a disability in the United States with a correlation coefficient (R) of -0.223 and weighted average of 11.7%. Similarly, the statistical analysis conducted on geographies consisting of 305,494,892 people shows a poor positive correlation between the proportion of Immigrants from Oceania and percentage of population with a disability in the United States with a correlation coefficient (R) of 0.147 and weighted average of 11.8%, a difference of 1.1%.
Disability Correlation Summary
| Measurement | Immigrants from Trinidad and Tobago | Immigrants from Oceania |
| Minimum | 2.0% | 6.6% |
| Maximum | 20.0% | 28.7% |
| Range | 18.0% | 22.1% |
| Mean | 11.5% | 13.8% |
| Median | 11.6% | 12.6% |
| Interquartile 25% (IQ1) | 10.3% | 11.7% |
| Interquartile 75% (IQ3) | 12.7% | 15.8% |
| Interquartile Range (IQR) | 2.5% | 4.1% |
| Standard Deviation (Sample) | 2.9% | 4.6% |
| Standard Deviation (Population) | 2.9% | 4.6% |
Demographics Similar to Immigrants from Trinidad and Tobago and Immigrants from Oceania by Disability
In terms of disability, the demographic groups most similar to Immigrants from Trinidad and Tobago are Immigrants from Haiti (11.7%, a difference of 0.020%), Syrian (11.7%, a difference of 0.020%), Cuban (11.7%, a difference of 0.10%), Pakistani (11.7%, a difference of 0.19%), and Estonian (11.7%, a difference of 0.20%). Similarly, the demographic groups most similar to Immigrants from Oceania are Icelander (11.8%, a difference of 0.010%), Immigrants from Honduras (11.8%, a difference of 0.17%), Immigrants from Armenia (11.7%, a difference of 0.36%), Greek (11.7%, a difference of 0.55%), and Immigrants from Central America (11.7%, a difference of 0.57%).
| Demographics | Rating | Rank | Disability |
| Immigrants | Haiti | 59.2 /100 | #162 | Average 11.7% |
| Immigrants | Trinidad and Tobago | 58.9 /100 | #163 | Average 11.7% |
| Syrians | 58.5 /100 | #164 | Average 11.7% |
| Cubans | 56.7 /100 | #165 | Average 11.7% |
| Pakistanis | 54.7 /100 | #166 | Average 11.7% |
| Estonians | 54.4 /100 | #167 | Average 11.7% |
| Immigrants | Latin America | 54.1 /100 | #168 | Average 11.7% |
| Immigrants | Austria | 53.4 /100 | #169 | Average 11.7% |
| Immigrants | Albania | 52.8 /100 | #170 | Average 11.7% |
| Immigrants | Southern Europe | 52.8 /100 | #171 | Average 11.7% |
| Trinidadians and Tobagonians | 52.7 /100 | #172 | Average 11.7% |
| Maltese | 50.6 /100 | #173 | Average 11.7% |
| Albanians | 50.0 /100 | #174 | Average 11.7% |
| Haitians | 48.6 /100 | #175 | Average 11.7% |
| Immigrants | Western Africa | 47.5 /100 | #176 | Average 11.7% |
| Immigrants | Central America | 46.6 /100 | #177 | Average 11.7% |
| Greeks | 46.2 /100 | #178 | Average 11.7% |
| Immigrants | Armenia | 41.9 /100 | #179 | Average 11.7% |
| Immigrants | Honduras | 37.8 /100 | #180 | Fair 11.8% |
| Immigrants | Oceania | 34.3 /100 | #181 | Fair 11.8% |
| Icelanders | 34.0 /100 | #182 | Fair 11.8% |