Immigrants from St. Vincent and the Grenadines vs New Zealander Vision Disability
COMPARE
Immigrants from St. Vincent and the Grenadines
New Zealander
Vision Disability
Vision Disability Comparison
Immigrants from St. Vincent and the Grenadines
New Zealanders
2.2%
VISION DISABILITY
30.3/ 100
METRIC RATING
187th/ 347
METRIC RANK
2.1%
VISION DISABILITY
88.2/ 100
METRIC RATING
132nd/ 347
METRIC RANK
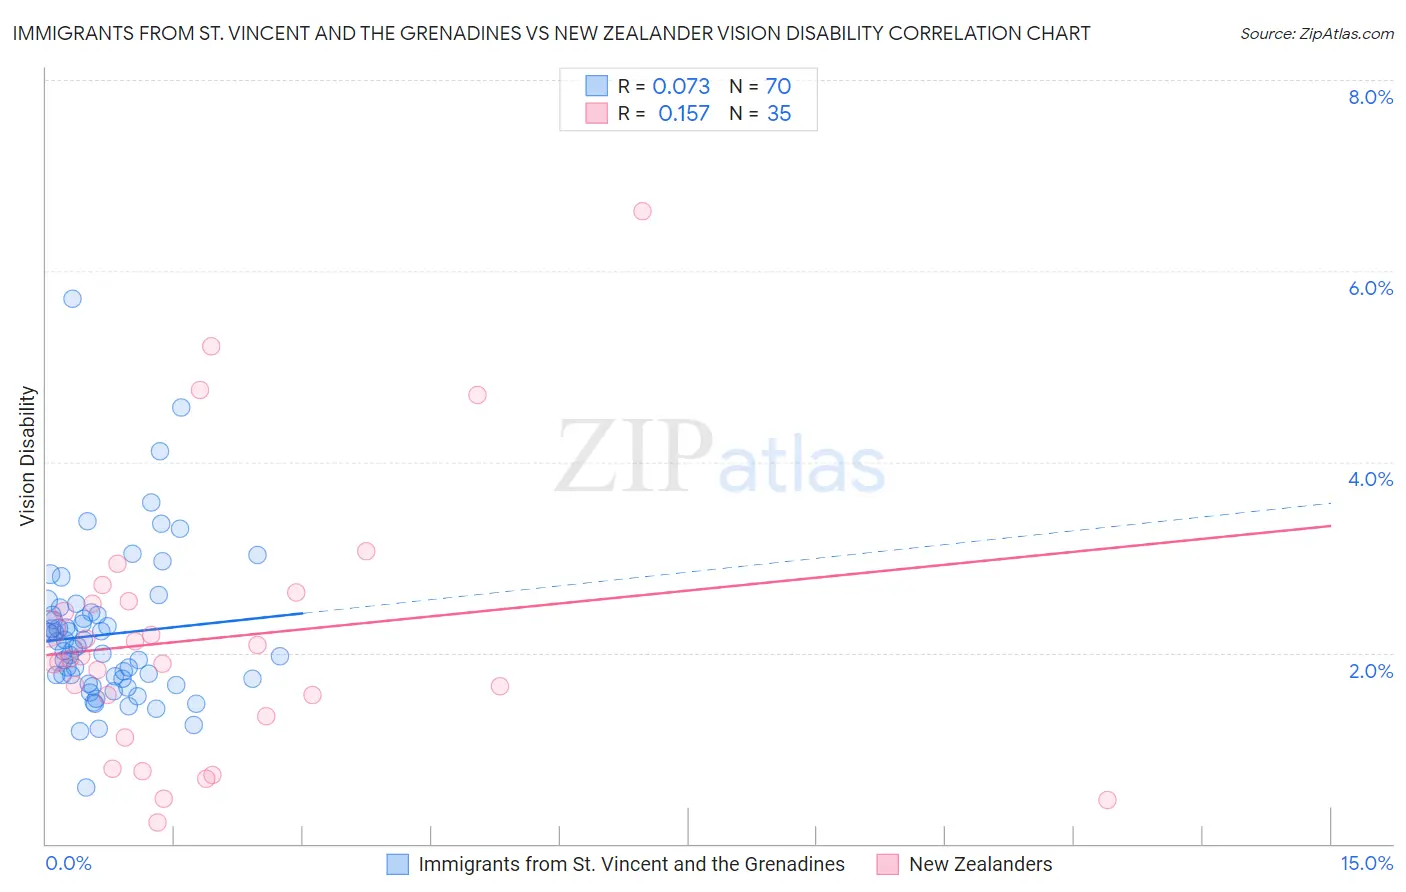
Immigrants from St. Vincent and the Grenadines vs New Zealander Vision Disability Correlation Chart
The statistical analysis conducted on geographies consisting of 56,186,719 people shows a slight positive correlation between the proportion of Immigrants from St. Vincent and the Grenadines and percentage of population with vision disability in the United States with a correlation coefficient (R) of 0.073 and weighted average of 2.2%. Similarly, the statistical analysis conducted on geographies consisting of 106,891,715 people shows a poor positive correlation between the proportion of New Zealanders and percentage of population with vision disability in the United States with a correlation coefficient (R) of 0.157 and weighted average of 2.1%, a difference of 4.6%.
Vision Disability Correlation Summary
| Measurement | Immigrants from St. Vincent and the Grenadines | New Zealander |
| Minimum | 0.59% | 0.22% |
| Maximum | 5.7% | 6.6% |
| Range | 5.1% | 6.4% |
| Mean | 2.2% | 2.2% |
| Median | 2.1% | 1.9% |
| Interquartile 25% (IQ1) | 1.7% | 1.3% |
| Interquartile 75% (IQ3) | 2.4% | 2.5% |
| Interquartile Range (IQR) | 0.67% | 1.2% |
| Standard Deviation (Sample) | 0.80% | 1.4% |
| Standard Deviation (Population) | 0.79% | 1.4% |
Similar Demographics by Vision Disability
Demographics Similar to Immigrants from St. Vincent and the Grenadines by Vision Disability
In terms of vision disability, the demographic groups most similar to Immigrants from St. Vincent and the Grenadines are Guyanese (2.2%, a difference of 0.11%), Salvadoran (2.2%, a difference of 0.21%), Native Hawaiian (2.2%, a difference of 0.22%), Immigrants from Middle Africa (2.2%, a difference of 0.23%), and Immigrants from Costa Rica (2.2%, a difference of 0.32%).
| Demographics | Rating | Rank | Vision Disability |
| Uruguayans | 42.7 /100 | #180 | Average 2.2% |
| Immigrants | Western Europe | 41.1 /100 | #181 | Average 2.2% |
| Costa Ricans | 40.7 /100 | #182 | Average 2.2% |
| Immigrants | Burma/Myanmar | 37.9 /100 | #183 | Fair 2.2% |
| Moroccans | 35.4 /100 | #184 | Fair 2.2% |
| Immigrants | Middle Africa | 33.5 /100 | #185 | Fair 2.2% |
| Native Hawaiians | 33.3 /100 | #186 | Fair 2.2% |
| Immigrants | St. Vincent and the Grenadines | 30.3 /100 | #187 | Fair 2.2% |
| Guyanese | 28.9 /100 | #188 | Fair 2.2% |
| Salvadorans | 27.4 /100 | #189 | Fair 2.2% |
| Immigrants | Costa Rica | 26.1 /100 | #190 | Fair 2.2% |
| Canadians | 25.8 /100 | #191 | Fair 2.2% |
| Europeans | 25.7 /100 | #192 | Fair 2.2% |
| British | 25.1 /100 | #193 | Fair 2.2% |
| Immigrants | Barbados | 24.0 /100 | #194 | Fair 2.2% |
Demographics Similar to New Zealanders by Vision Disability
In terms of vision disability, the demographic groups most similar to New Zealanders are Immigrants from Hungary (2.1%, a difference of 0.080%), Immigrants from Kenya (2.1%, a difference of 0.090%), Immigrants from Cameroon (2.1%, a difference of 0.10%), Syrian (2.1%, a difference of 0.10%), and Immigrants from Chile (2.1%, a difference of 0.13%).
| Demographics | Rating | Rank | Vision Disability |
| Immigrants | Venezuela | 89.8 /100 | #125 | Excellent 2.1% |
| Immigrants | Peru | 89.5 /100 | #126 | Excellent 2.1% |
| Sudanese | 89.2 /100 | #127 | Excellent 2.1% |
| Immigrants | Chile | 89.0 /100 | #128 | Excellent 2.1% |
| Immigrants | Cameroon | 88.8 /100 | #129 | Excellent 2.1% |
| Immigrants | Kenya | 88.7 /100 | #130 | Excellent 2.1% |
| Immigrants | Hungary | 88.7 /100 | #131 | Excellent 2.1% |
| New Zealanders | 88.2 /100 | #132 | Excellent 2.1% |
| Syrians | 87.5 /100 | #133 | Excellent 2.1% |
| Venezuelans | 87.2 /100 | #134 | Excellent 2.1% |
| Vietnamese | 86.7 /100 | #135 | Excellent 2.1% |
| Czechs | 86.3 /100 | #136 | Excellent 2.1% |
| Immigrants | South Eastern Asia | 86.3 /100 | #137 | Excellent 2.1% |
| Arabs | 86.3 /100 | #138 | Excellent 2.1% |
| Immigrants | Morocco | 85.2 /100 | #139 | Excellent 2.1% |