Immigrants from South Central Asia vs Immigrants from Ethiopia Disability
COMPARE
Immigrants from South Central Asia
Immigrants from Ethiopia
Disability
Disability Comparison
Immigrants from South Central Asia
Immigrants from Ethiopia
9.9%
DISABILITY
100.0/ 100
METRIC RATING
6th/ 347
METRIC RANK
10.7%
DISABILITY
100.0/ 100
METRIC RATING
34th/ 347
METRIC RANK
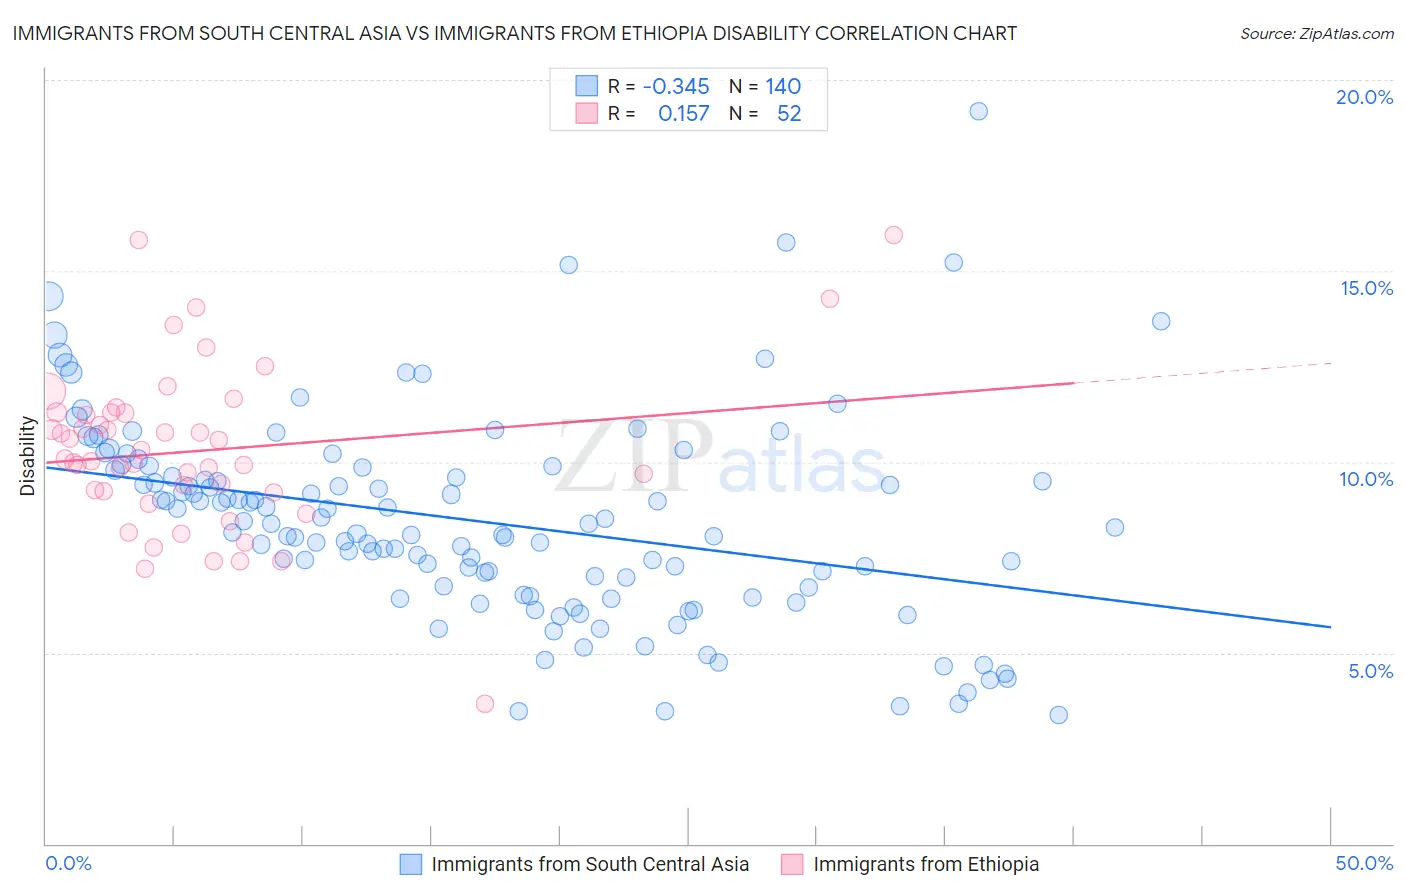
Immigrants from South Central Asia vs Immigrants from Ethiopia Disability Correlation Chart
The statistical analysis conducted on geographies consisting of 473,067,496 people shows a mild negative correlation between the proportion of Immigrants from South Central Asia and percentage of population with a disability in the United States with a correlation coefficient (R) of -0.345 and weighted average of 9.9%. Similarly, the statistical analysis conducted on geographies consisting of 211,552,130 people shows a poor positive correlation between the proportion of Immigrants from Ethiopia and percentage of population with a disability in the United States with a correlation coefficient (R) of 0.157 and weighted average of 10.7%, a difference of 7.5%.
Disability Correlation Summary
| Measurement | Immigrants from South Central Asia | Immigrants from Ethiopia |
| Minimum | 3.4% | 3.7% |
| Maximum | 19.2% | 15.9% |
| Range | 15.8% | 12.3% |
| Mean | 8.5% | 10.3% |
| Median | 8.3% | 10.0% |
| Interquartile 25% (IQ1) | 6.7% | 9.2% |
| Interquartile 75% (IQ3) | 9.8% | 11.3% |
| Interquartile Range (IQR) | 3.1% | 2.1% |
| Standard Deviation (Sample) | 2.7% | 2.2% |
| Standard Deviation (Population) | 2.7% | 2.2% |
Similar Demographics by Disability
Demographics Similar to Immigrants from South Central Asia by Disability
In terms of disability, the demographic groups most similar to Immigrants from South Central Asia are Immigrants from Singapore (10.0%, a difference of 0.31%), Bolivian (10.0%, a difference of 0.54%), Immigrants from Bolivia (9.9%, a difference of 0.84%), Immigrants from Hong Kong (10.0%, a difference of 0.84%), and Immigrants from China (10.1%, a difference of 1.7%).
| Demographics | Rating | Rank | Disability |
| Immigrants | India | 100.0 /100 | #1 | Exceptional 9.5% |
| Filipinos | 100.0 /100 | #2 | Exceptional 9.6% |
| Immigrants | Taiwan | 100.0 /100 | #3 | Exceptional 9.6% |
| Thais | 100.0 /100 | #4 | Exceptional 9.7% |
| Immigrants | Bolivia | 100.0 /100 | #5 | Exceptional 9.9% |
| Immigrants | South Central Asia | 100.0 /100 | #6 | Exceptional 9.9% |
| Immigrants | Singapore | 100.0 /100 | #7 | Exceptional 10.0% |
| Bolivians | 100.0 /100 | #8 | Exceptional 10.0% |
| Immigrants | Hong Kong | 100.0 /100 | #9 | Exceptional 10.0% |
| Immigrants | China | 100.0 /100 | #10 | Exceptional 10.1% |
| Iranians | 100.0 /100 | #11 | Exceptional 10.1% |
| Immigrants | Israel | 100.0 /100 | #12 | Exceptional 10.1% |
| Immigrants | Eastern Asia | 100.0 /100 | #13 | Exceptional 10.2% |
| Immigrants | Korea | 100.0 /100 | #14 | Exceptional 10.2% |
| Okinawans | 100.0 /100 | #15 | Exceptional 10.3% |
Demographics Similar to Immigrants from Ethiopia by Disability
In terms of disability, the demographic groups most similar to Immigrants from Ethiopia are Immigrants from Indonesia (10.7%, a difference of 0.010%), Ethiopian (10.7%, a difference of 0.070%), Turkish (10.7%, a difference of 0.080%), Immigrants from Kuwait (10.7%, a difference of 0.22%), and Paraguayan (10.6%, a difference of 0.47%).
| Demographics | Rating | Rank | Disability |
| Cypriots | 100.0 /100 | #27 | Exceptional 10.6% |
| Egyptians | 100.0 /100 | #28 | Exceptional 10.6% |
| Immigrants | Argentina | 100.0 /100 | #29 | Exceptional 10.6% |
| Immigrants | Turkey | 100.0 /100 | #30 | Exceptional 10.6% |
| Immigrants | Egypt | 100.0 /100 | #31 | Exceptional 10.6% |
| Paraguayans | 100.0 /100 | #32 | Exceptional 10.6% |
| Immigrants | Kuwait | 100.0 /100 | #33 | Exceptional 10.7% |
| Immigrants | Ethiopia | 100.0 /100 | #34 | Exceptional 10.7% |
| Immigrants | Indonesia | 100.0 /100 | #35 | Exceptional 10.7% |
| Ethiopians | 100.0 /100 | #36 | Exceptional 10.7% |
| Turks | 100.0 /100 | #37 | Exceptional 10.7% |
| Afghans | 99.9 /100 | #38 | Exceptional 10.8% |
| Cambodians | 99.9 /100 | #39 | Exceptional 10.8% |
| Mongolians | 99.9 /100 | #40 | Exceptional 10.8% |
| Immigrants | Australia | 99.9 /100 | #41 | Exceptional 10.8% |