Immigrants from Singapore vs Immigrants from Turkey Disability Age 65 to 74
COMPARE
Immigrants from Singapore
Immigrants from Turkey
Disability Age 65 to 74
Disability Age 65 to 74 Comparison
Immigrants from Singapore
Immigrants from Turkey
20.4%
DISABILITY AGE 65 TO 74
100.0/ 100
METRIC RATING
13th/ 347
METRIC RANK
21.4%
DISABILITY AGE 65 TO 74
99.7/ 100
METRIC RATING
46th/ 347
METRIC RANK
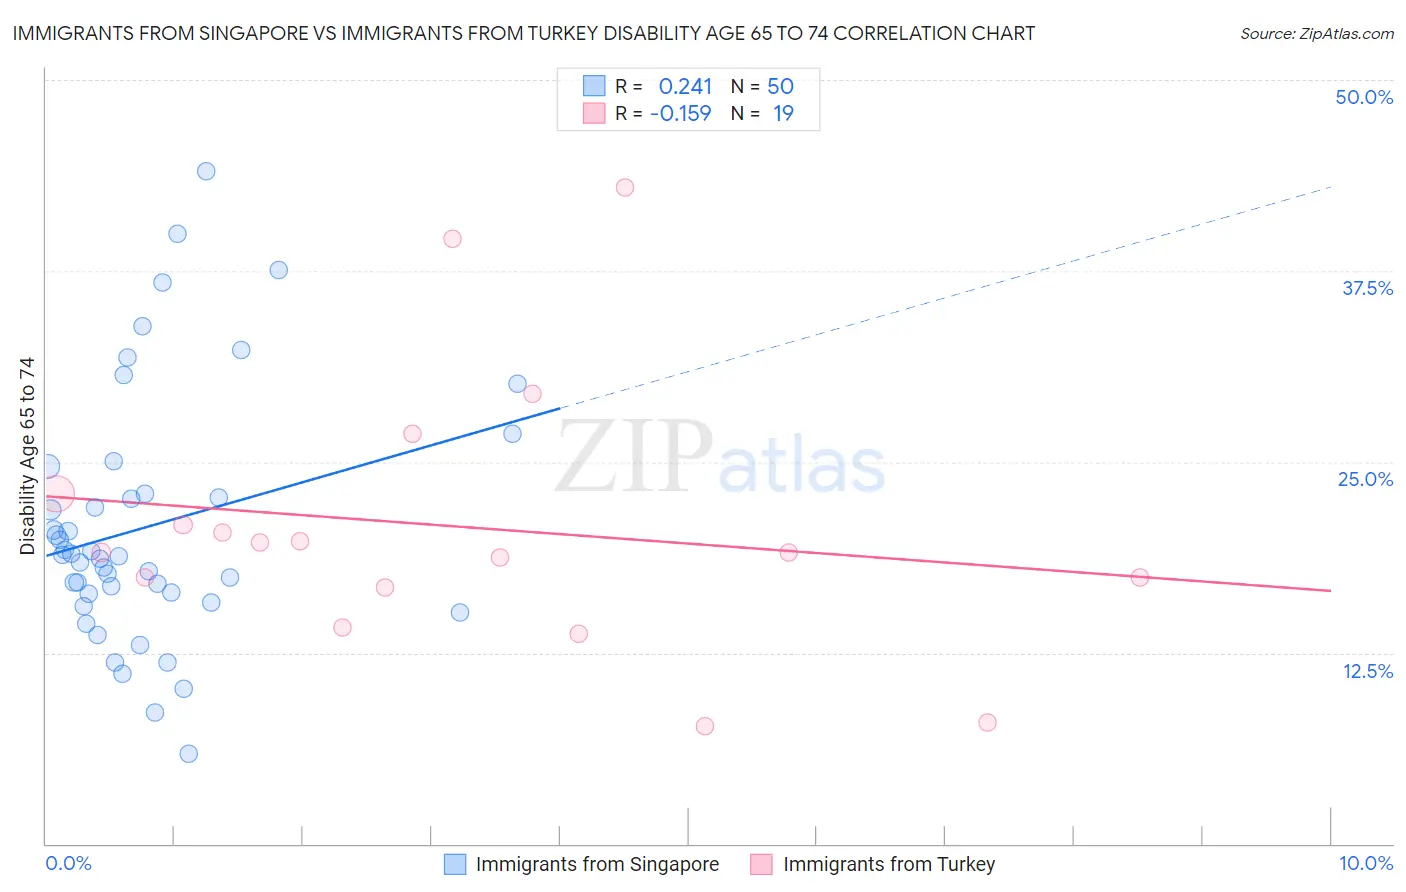
Immigrants from Singapore vs Immigrants from Turkey Disability Age 65 to 74 Correlation Chart
The statistical analysis conducted on geographies consisting of 137,333,413 people shows a weak positive correlation between the proportion of Immigrants from Singapore and percentage of population with a disability between the ages 65 and 75 in the United States with a correlation coefficient (R) of 0.241 and weighted average of 20.4%. Similarly, the statistical analysis conducted on geographies consisting of 222,810,745 people shows a poor negative correlation between the proportion of Immigrants from Turkey and percentage of population with a disability between the ages 65 and 75 in the United States with a correlation coefficient (R) of -0.159 and weighted average of 21.4%, a difference of 4.6%.
Disability Age 65 to 74 Correlation Summary
| Measurement | Immigrants from Singapore | Immigrants from Turkey |
| Minimum | 5.9% | 7.7% |
| Maximum | 44.0% | 43.0% |
| Range | 38.1% | 35.3% |
| Mean | 20.8% | 20.8% |
| Median | 18.9% | 19.1% |
| Interquartile 25% (IQ1) | 16.4% | 16.8% |
| Interquartile 75% (IQ3) | 22.9% | 22.9% |
| Interquartile Range (IQR) | 6.5% | 6.1% |
| Standard Deviation (Sample) | 8.2% | 9.0% |
| Standard Deviation (Population) | 8.1% | 8.7% |
Similar Demographics by Disability Age 65 to 74
Demographics Similar to Immigrants from Singapore by Disability Age 65 to 74
In terms of disability age 65 to 74, the demographic groups most similar to Immigrants from Singapore are Immigrants from Korea (20.4%, a difference of 0.38%), Indian (Asian) (20.5%, a difference of 0.47%), Paraguayan (20.5%, a difference of 0.49%), Immigrants from Lithuania (20.5%, a difference of 0.55%), and Immigrants from Ireland (20.3%, a difference of 0.60%).
| Demographics | Rating | Rank | Disability Age 65 to 74 |
| Iranians | 100.0 /100 | #6 | Exceptional 19.9% |
| Cypriots | 100.0 /100 | #7 | Exceptional 20.1% |
| Thais | 100.0 /100 | #8 | Exceptional 20.1% |
| Immigrants | China | 100.0 /100 | #9 | Exceptional 20.3% |
| Immigrants | Eastern Asia | 100.0 /100 | #10 | Exceptional 20.3% |
| Immigrants | Ireland | 100.0 /100 | #11 | Exceptional 20.3% |
| Immigrants | Korea | 100.0 /100 | #12 | Exceptional 20.4% |
| Immigrants | Singapore | 100.0 /100 | #13 | Exceptional 20.4% |
| Indians (Asian) | 100.0 /100 | #14 | Exceptional 20.5% |
| Paraguayans | 100.0 /100 | #15 | Exceptional 20.5% |
| Immigrants | Lithuania | 100.0 /100 | #16 | Exceptional 20.5% |
| Immigrants | South Central Asia | 100.0 /100 | #17 | Exceptional 20.6% |
| Eastern Europeans | 100.0 /100 | #18 | Exceptional 20.6% |
| Burmese | 100.0 /100 | #19 | Exceptional 20.6% |
| Okinawans | 100.0 /100 | #20 | Exceptional 20.7% |
Demographics Similar to Immigrants from Turkey by Disability Age 65 to 74
In terms of disability age 65 to 74, the demographic groups most similar to Immigrants from Turkey are Immigrants from Bulgaria (21.4%, a difference of 0.0%), Asian (21.4%, a difference of 0.030%), Estonian (21.4%, a difference of 0.050%), Lithuanian (21.4%, a difference of 0.050%), and Luxembourger (21.4%, a difference of 0.050%).
| Demographics | Rating | Rank | Disability Age 65 to 74 |
| Argentineans | 99.8 /100 | #39 | Exceptional 21.2% |
| Latvians | 99.8 /100 | #40 | Exceptional 21.2% |
| Immigrants | Austria | 99.8 /100 | #41 | Exceptional 21.2% |
| Macedonians | 99.7 /100 | #42 | Exceptional 21.3% |
| Immigrants | Croatia | 99.7 /100 | #43 | Exceptional 21.3% |
| Estonians | 99.7 /100 | #44 | Exceptional 21.4% |
| Asians | 99.7 /100 | #45 | Exceptional 21.4% |
| Immigrants | Turkey | 99.7 /100 | #46 | Exceptional 21.4% |
| Immigrants | Bulgaria | 99.7 /100 | #47 | Exceptional 21.4% |
| Lithuanians | 99.7 /100 | #48 | Exceptional 21.4% |
| Luxembourgers | 99.7 /100 | #49 | Exceptional 21.4% |
| Immigrants | Malaysia | 99.7 /100 | #50 | Exceptional 21.4% |
| Immigrants | Serbia | 99.6 /100 | #51 | Exceptional 21.4% |
| Immigrants | France | 99.6 /100 | #52 | Exceptional 21.5% |
| Bhutanese | 99.6 /100 | #53 | Exceptional 21.5% |