Greek vs Immigrants from Turkey Disability Age 65 to 74
COMPARE
Greek
Immigrants from Turkey
Disability Age 65 to 74
Disability Age 65 to 74 Comparison
Greeks
Immigrants from Turkey
21.8%
DISABILITY AGE 65 TO 74
99.0/ 100
METRIC RATING
76th/ 347
METRIC RANK
21.4%
DISABILITY AGE 65 TO 74
99.7/ 100
METRIC RATING
46th/ 347
METRIC RANK
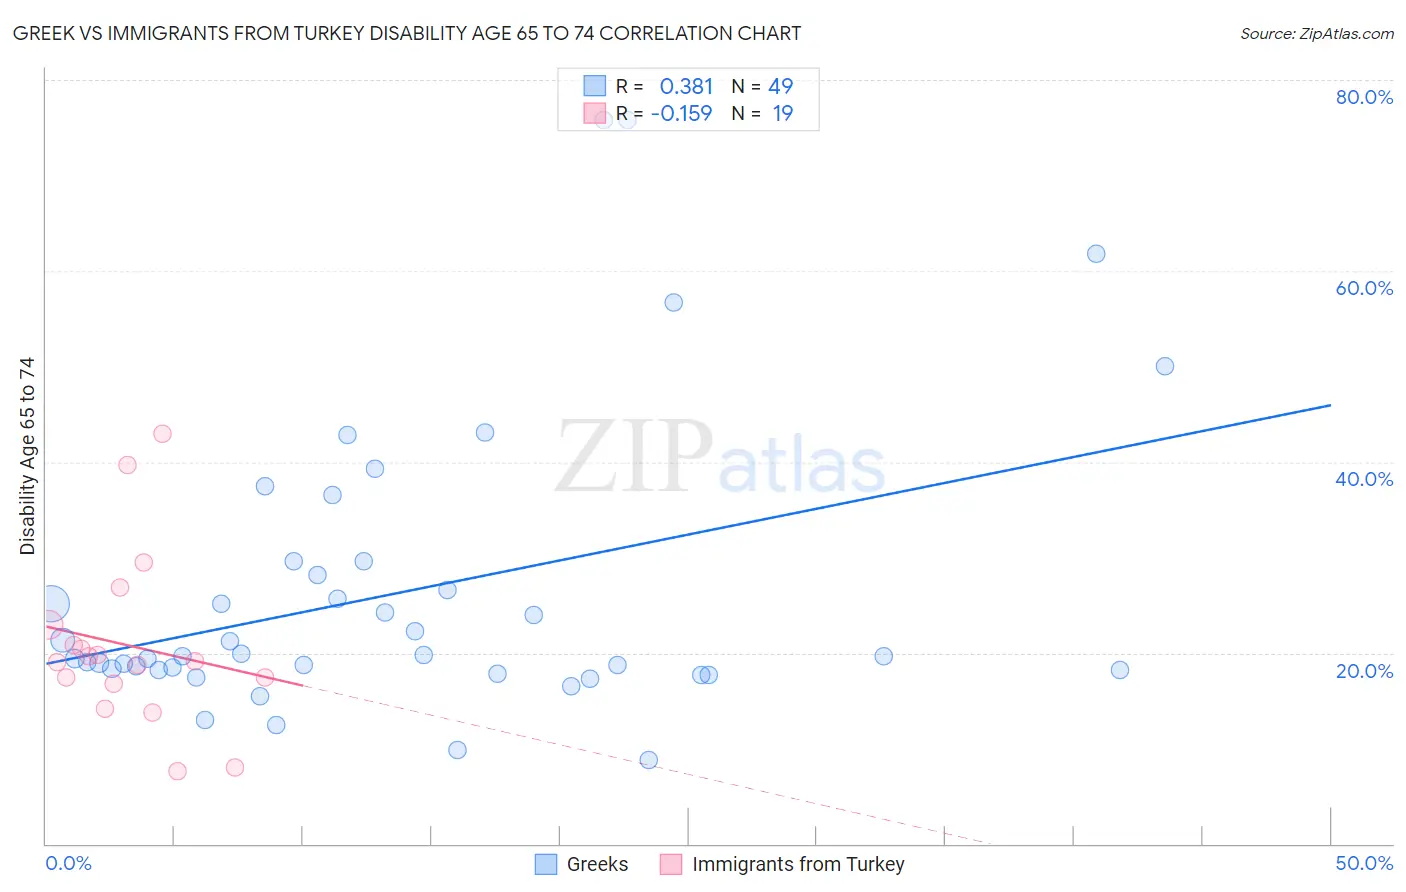
Greek vs Immigrants from Turkey Disability Age 65 to 74 Correlation Chart
The statistical analysis conducted on geographies consisting of 481,507,065 people shows a mild positive correlation between the proportion of Greeks and percentage of population with a disability between the ages 65 and 75 in the United States with a correlation coefficient (R) of 0.381 and weighted average of 21.8%. Similarly, the statistical analysis conducted on geographies consisting of 222,810,745 people shows a poor negative correlation between the proportion of Immigrants from Turkey and percentage of population with a disability between the ages 65 and 75 in the United States with a correlation coefficient (R) of -0.159 and weighted average of 21.4%, a difference of 1.8%.
Disability Age 65 to 74 Correlation Summary
| Measurement | Greek | Immigrants from Turkey |
| Minimum | 8.8% | 7.7% |
| Maximum | 75.9% | 43.0% |
| Range | 67.1% | 35.3% |
| Mean | 26.3% | 20.8% |
| Median | 19.6% | 19.1% |
| Interquartile 25% (IQ1) | 18.2% | 16.8% |
| Interquartile 75% (IQ3) | 28.9% | 22.9% |
| Interquartile Range (IQR) | 10.7% | 6.1% |
| Standard Deviation (Sample) | 15.2% | 9.0% |
| Standard Deviation (Population) | 15.1% | 8.7% |
Similar Demographics by Disability Age 65 to 74
Demographics Similar to Greeks by Disability Age 65 to 74
In terms of disability age 65 to 74, the demographic groups most similar to Greeks are Mongolian (21.8%, a difference of 0.010%), Cambodian (21.8%, a difference of 0.030%), Immigrants from Venezuela (21.8%, a difference of 0.040%), Immigrants from Poland (21.8%, a difference of 0.060%), and Immigrants from Eastern Europe (21.8%, a difference of 0.11%).
| Demographics | Rating | Rank | Disability Age 65 to 74 |
| Immigrants | Egypt | 99.2 /100 | #69 | Exceptional 21.7% |
| Chinese | 99.2 /100 | #70 | Exceptional 21.7% |
| Immigrants | Belarus | 99.2 /100 | #71 | Exceptional 21.7% |
| Immigrants | Hungary | 99.2 /100 | #72 | Exceptional 21.7% |
| Immigrants | Venezuela | 99.0 /100 | #73 | Exceptional 21.8% |
| Cambodians | 99.0 /100 | #74 | Exceptional 21.8% |
| Mongolians | 99.0 /100 | #75 | Exceptional 21.8% |
| Greeks | 99.0 /100 | #76 | Exceptional 21.8% |
| Immigrants | Poland | 99.0 /100 | #77 | Exceptional 21.8% |
| Immigrants | Eastern Europe | 99.0 /100 | #78 | Exceptional 21.8% |
| Venezuelans | 99.0 /100 | #79 | Exceptional 21.8% |
| Immigrants | Norway | 98.9 /100 | #80 | Exceptional 21.8% |
| Croatians | 98.9 /100 | #81 | Exceptional 21.8% |
| Immigrants | Indonesia | 98.7 /100 | #82 | Exceptional 21.9% |
| Immigrants | Brazil | 98.5 /100 | #83 | Exceptional 21.9% |
Demographics Similar to Immigrants from Turkey by Disability Age 65 to 74
In terms of disability age 65 to 74, the demographic groups most similar to Immigrants from Turkey are Immigrants from Bulgaria (21.4%, a difference of 0.0%), Asian (21.4%, a difference of 0.030%), Estonian (21.4%, a difference of 0.050%), Lithuanian (21.4%, a difference of 0.050%), and Luxembourger (21.4%, a difference of 0.050%).
| Demographics | Rating | Rank | Disability Age 65 to 74 |
| Argentineans | 99.8 /100 | #39 | Exceptional 21.2% |
| Latvians | 99.8 /100 | #40 | Exceptional 21.2% |
| Immigrants | Austria | 99.8 /100 | #41 | Exceptional 21.2% |
| Macedonians | 99.7 /100 | #42 | Exceptional 21.3% |
| Immigrants | Croatia | 99.7 /100 | #43 | Exceptional 21.3% |
| Estonians | 99.7 /100 | #44 | Exceptional 21.4% |
| Asians | 99.7 /100 | #45 | Exceptional 21.4% |
| Immigrants | Turkey | 99.7 /100 | #46 | Exceptional 21.4% |
| Immigrants | Bulgaria | 99.7 /100 | #47 | Exceptional 21.4% |
| Lithuanians | 99.7 /100 | #48 | Exceptional 21.4% |
| Luxembourgers | 99.7 /100 | #49 | Exceptional 21.4% |
| Immigrants | Malaysia | 99.7 /100 | #50 | Exceptional 21.4% |
| Immigrants | Serbia | 99.6 /100 | #51 | Exceptional 21.4% |
| Immigrants | France | 99.6 /100 | #52 | Exceptional 21.5% |
| Bhutanese | 99.6 /100 | #53 | Exceptional 21.5% |