Immigrants from Sierra Leone vs Immigrants from Ecuador Disability Age Over 75
COMPARE
Immigrants from Sierra Leone
Immigrants from Ecuador
Disability Age Over 75
Disability Age Over 75 Comparison
Immigrants from Sierra Leone
Immigrants from Ecuador
47.2%
DISABILITY AGE OVER 75
64.4/ 100
METRIC RATING
166th/ 347
METRIC RANK
47.4%
DISABILITY AGE OVER 75
41.7/ 100
METRIC RATING
180th/ 347
METRIC RANK
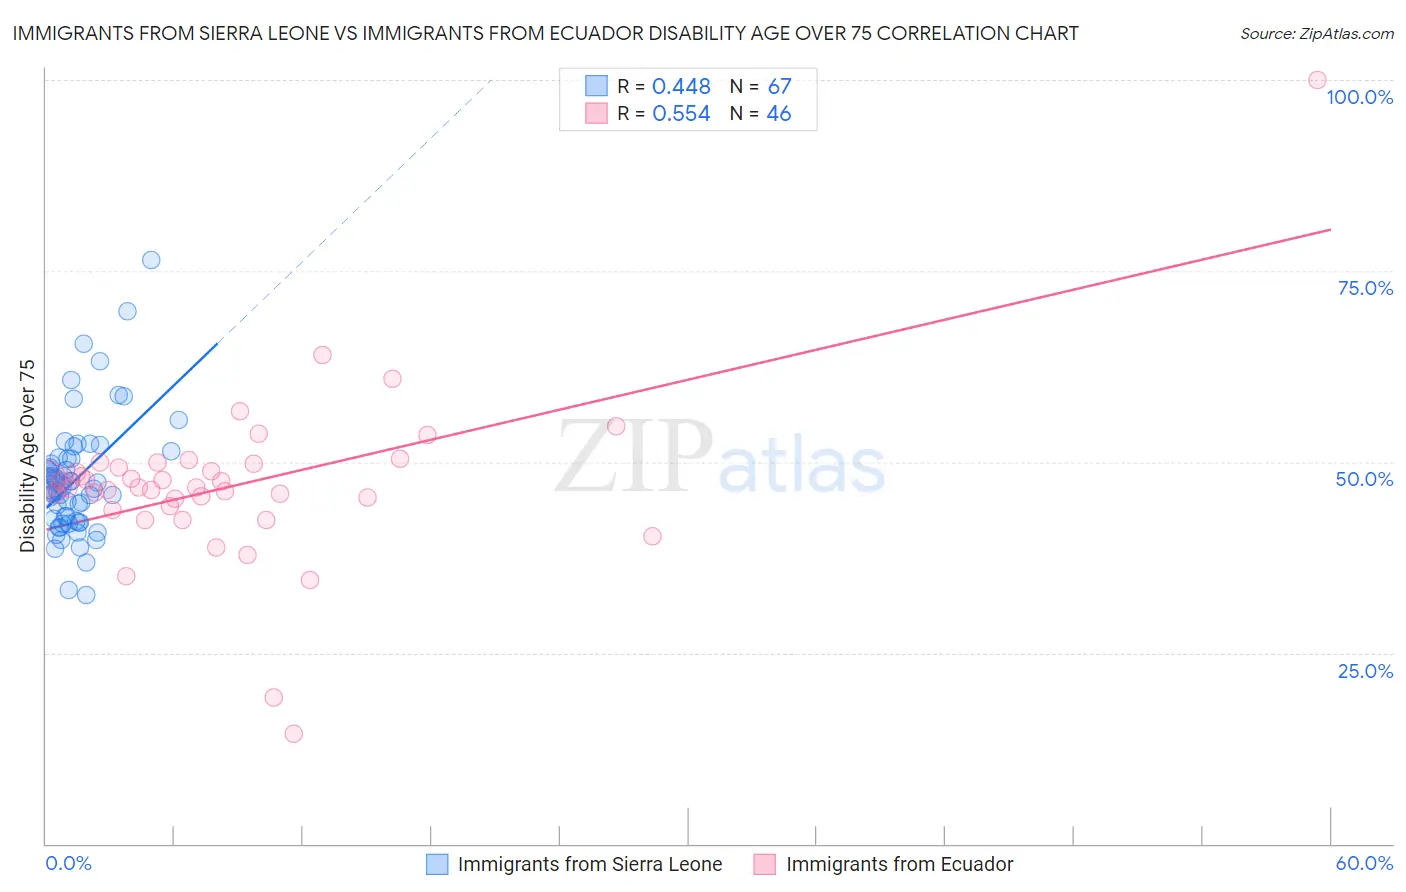
Immigrants from Sierra Leone vs Immigrants from Ecuador Disability Age Over 75 Correlation Chart
The statistical analysis conducted on geographies consisting of 101,591,179 people shows a moderate positive correlation between the proportion of Immigrants from Sierra Leone and percentage of population with a disability over the age of 75 in the United States with a correlation coefficient (R) of 0.448 and weighted average of 47.2%. Similarly, the statistical analysis conducted on geographies consisting of 270,547,812 people shows a substantial positive correlation between the proportion of Immigrants from Ecuador and percentage of population with a disability over the age of 75 in the United States with a correlation coefficient (R) of 0.554 and weighted average of 47.4%, a difference of 0.52%.
Disability Age Over 75 Correlation Summary
| Measurement | Immigrants from Sierra Leone | Immigrants from Ecuador |
| Minimum | 32.6% | 14.5% |
| Maximum | 76.4% | 100.0% |
| Range | 43.8% | 85.5% |
| Mean | 47.7% | 47.0% |
| Median | 46.7% | 46.6% |
| Interquartile 25% (IQ1) | 42.3% | 44.1% |
| Interquartile 75% (IQ3) | 50.4% | 49.7% |
| Interquartile Range (IQR) | 8.1% | 5.5% |
| Standard Deviation (Sample) | 7.8% | 11.6% |
| Standard Deviation (Population) | 7.7% | 11.4% |
Demographics Similar to Immigrants from Sierra Leone and Immigrants from Ecuador by Disability Age Over 75
In terms of disability age over 75, the demographic groups most similar to Immigrants from Sierra Leone are Immigrants from Zimbabwe (47.2%, a difference of 0.0%), French (47.2%, a difference of 0.010%), Immigrants from Eastern Africa (47.2%, a difference of 0.030%), Moroccan (47.2%, a difference of 0.040%), and Kenyan (47.2%, a difference of 0.13%). Similarly, the demographic groups most similar to Immigrants from Ecuador are Sierra Leonean (47.4%, a difference of 0.0%), Cuban (47.4%, a difference of 0.010%), Immigrants from Kazakhstan (47.4%, a difference of 0.030%), Immigrants from Moldova (47.4%, a difference of 0.040%), and Delaware (47.5%, a difference of 0.060%).
| Demographics | Rating | Rank | Disability Age Over 75 |
| Immigrants | Eastern Africa | 65.5 /100 | #163 | Good 47.2% |
| French | 64.6 /100 | #164 | Good 47.2% |
| Immigrants | Zimbabwe | 64.4 /100 | #165 | Good 47.2% |
| Immigrants | Sierra Leone | 64.4 /100 | #166 | Good 47.2% |
| Moroccans | 62.9 /100 | #167 | Good 47.2% |
| Kenyans | 58.8 /100 | #168 | Average 47.2% |
| Celtics | 58.7 /100 | #169 | Average 47.2% |
| German Russians | 56.2 /100 | #170 | Average 47.3% |
| Immigrants | Africa | 53.6 /100 | #171 | Average 47.3% |
| Scotch-Irish | 52.5 /100 | #172 | Average 47.3% |
| Alsatians | 51.9 /100 | #173 | Average 47.3% |
| Whites/Caucasians | 50.0 /100 | #174 | Average 47.3% |
| Immigrants | Haiti | 49.7 /100 | #175 | Average 47.3% |
| Ecuadorians | 46.7 /100 | #176 | Average 47.4% |
| Haitians | 44.6 /100 | #177 | Average 47.4% |
| Cubans | 42.1 /100 | #178 | Average 47.4% |
| Sierra Leoneans | 41.7 /100 | #179 | Average 47.4% |
| Immigrants | Ecuador | 41.7 /100 | #180 | Average 47.4% |
| Immigrants | Kazakhstan | 40.4 /100 | #181 | Average 47.4% |
| Immigrants | Moldova | 39.9 /100 | #182 | Fair 47.4% |
| Delaware | 39.1 /100 | #183 | Fair 47.5% |