Immigrants from Brazil vs Immigrants from Ecuador Disability Age Over 75
COMPARE
Immigrants from Brazil
Immigrants from Ecuador
Disability Age Over 75
Disability Age Over 75 Comparison
Immigrants from Brazil
Immigrants from Ecuador
46.3%
DISABILITY AGE OVER 75
98.0/ 100
METRIC RATING
95th/ 347
METRIC RANK
47.4%
DISABILITY AGE OVER 75
41.7/ 100
METRIC RATING
180th/ 347
METRIC RANK
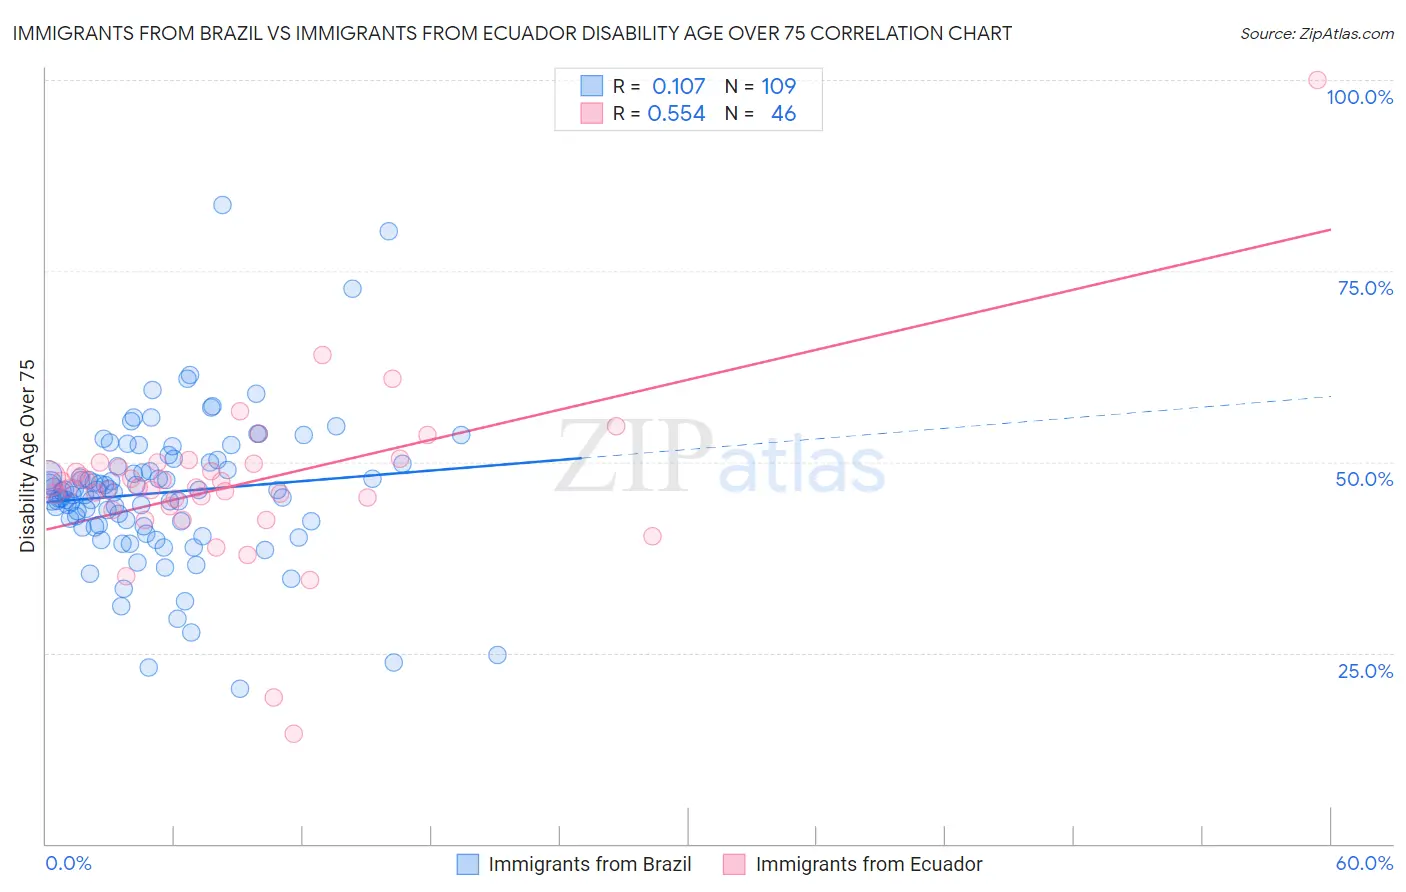
Immigrants from Brazil vs Immigrants from Ecuador Disability Age Over 75 Correlation Chart
The statistical analysis conducted on geographies consisting of 342,544,403 people shows a poor positive correlation between the proportion of Immigrants from Brazil and percentage of population with a disability over the age of 75 in the United States with a correlation coefficient (R) of 0.107 and weighted average of 46.3%. Similarly, the statistical analysis conducted on geographies consisting of 270,547,812 people shows a substantial positive correlation between the proportion of Immigrants from Ecuador and percentage of population with a disability over the age of 75 in the United States with a correlation coefficient (R) of 0.554 and weighted average of 47.4%, a difference of 2.4%.
Disability Age Over 75 Correlation Summary
| Measurement | Immigrants from Brazil | Immigrants from Ecuador |
| Minimum | 20.2% | 14.5% |
| Maximum | 83.7% | 100.0% |
| Range | 63.4% | 85.5% |
| Mean | 46.0% | 47.0% |
| Median | 46.1% | 46.6% |
| Interquartile 25% (IQ1) | 41.7% | 44.1% |
| Interquartile 75% (IQ3) | 49.8% | 49.7% |
| Interquartile Range (IQR) | 8.2% | 5.5% |
| Standard Deviation (Sample) | 9.5% | 11.6% |
| Standard Deviation (Population) | 9.5% | 11.4% |
Similar Demographics by Disability Age Over 75
Demographics Similar to Immigrants from Brazil by Disability Age Over 75
In terms of disability age over 75, the demographic groups most similar to Immigrants from Brazil are Immigrants from China (46.3%, a difference of 0.010%), Albanian (46.3%, a difference of 0.030%), Finnish (46.3%, a difference of 0.030%), Immigrants from Japan (46.3%, a difference of 0.040%), and German (46.3%, a difference of 0.060%).
| Demographics | Rating | Rank | Disability Age Over 75 |
| Uruguayans | 98.4 /100 | #88 | Exceptional 46.2% |
| Immigrants | Saudi Arabia | 98.4 /100 | #89 | Exceptional 46.3% |
| Northern Europeans | 98.3 /100 | #90 | Exceptional 46.3% |
| Immigrants | Egypt | 98.3 /100 | #91 | Exceptional 46.3% |
| Germans | 98.2 /100 | #92 | Exceptional 46.3% |
| Ugandans | 98.2 /100 | #93 | Exceptional 46.3% |
| Albanians | 98.1 /100 | #94 | Exceptional 46.3% |
| Immigrants | Brazil | 98.0 /100 | #95 | Exceptional 46.3% |
| Immigrants | China | 98.0 /100 | #96 | Exceptional 46.3% |
| Finns | 97.9 /100 | #97 | Exceptional 46.3% |
| Immigrants | Japan | 97.8 /100 | #98 | Exceptional 46.3% |
| Palestinians | 97.7 /100 | #99 | Exceptional 46.3% |
| Immigrants | Eastern Europe | 97.7 /100 | #100 | Exceptional 46.3% |
| Mongolians | 97.7 /100 | #101 | Exceptional 46.3% |
| Immigrants | Malaysia | 97.1 /100 | #102 | Exceptional 46.4% |
Demographics Similar to Immigrants from Ecuador by Disability Age Over 75
In terms of disability age over 75, the demographic groups most similar to Immigrants from Ecuador are Sierra Leonean (47.4%, a difference of 0.0%), Cuban (47.4%, a difference of 0.010%), Immigrants from Kazakhstan (47.4%, a difference of 0.030%), Immigrants from Moldova (47.4%, a difference of 0.040%), and Delaware (47.5%, a difference of 0.060%).
| Demographics | Rating | Rank | Disability Age Over 75 |
| Alsatians | 51.9 /100 | #173 | Average 47.3% |
| Whites/Caucasians | 50.0 /100 | #174 | Average 47.3% |
| Immigrants | Haiti | 49.7 /100 | #175 | Average 47.3% |
| Ecuadorians | 46.7 /100 | #176 | Average 47.4% |
| Haitians | 44.6 /100 | #177 | Average 47.4% |
| Cubans | 42.1 /100 | #178 | Average 47.4% |
| Sierra Leoneans | 41.7 /100 | #179 | Average 47.4% |
| Immigrants | Ecuador | 41.7 /100 | #180 | Average 47.4% |
| Immigrants | Kazakhstan | 40.4 /100 | #181 | Average 47.4% |
| Immigrants | Moldova | 39.9 /100 | #182 | Fair 47.4% |
| Delaware | 39.1 /100 | #183 | Fair 47.5% |
| Immigrants | Nigeria | 34.0 /100 | #184 | Fair 47.5% |
| Ghanaians | 33.0 /100 | #185 | Fair 47.5% |
| Sudanese | 32.0 /100 | #186 | Fair 47.5% |
| Immigrants | Sudan | 31.8 /100 | #187 | Fair 47.5% |