Immigrants from Senegal vs Creek Vision Disability
COMPARE
Immigrants from Senegal
Creek
Vision Disability
Vision Disability Comparison
Immigrants from Senegal
Creek
2.3%
VISION DISABILITY
3.8/ 100
METRIC RATING
222nd/ 347
METRIC RANK
3.2%
VISION DISABILITY
0.0/ 100
METRIC RATING
340th/ 347
METRIC RANK
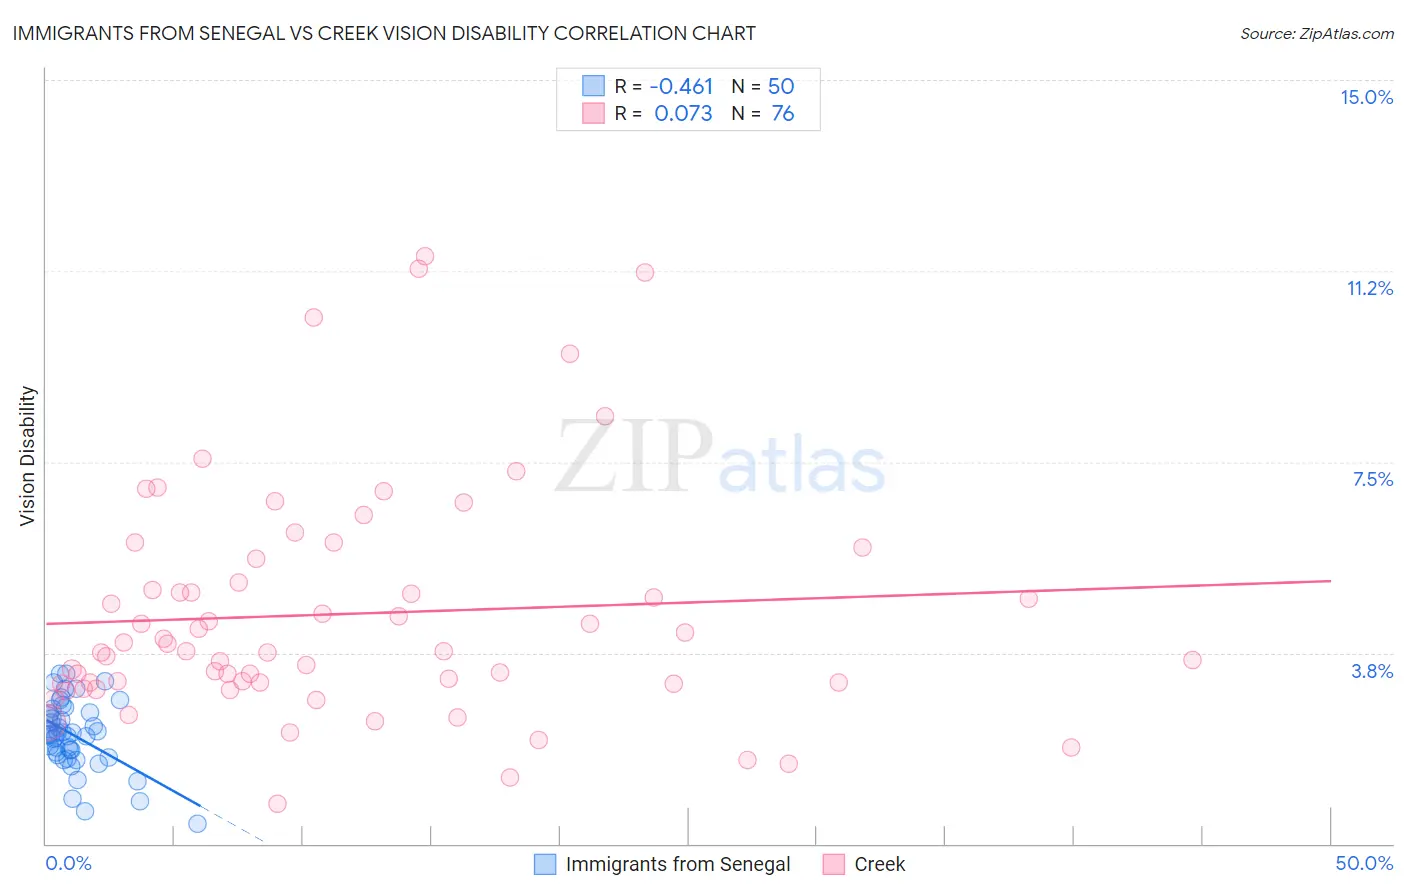
Immigrants from Senegal vs Creek Vision Disability Correlation Chart
The statistical analysis conducted on geographies consisting of 90,101,349 people shows a moderate negative correlation between the proportion of Immigrants from Senegal and percentage of population with vision disability in the United States with a correlation coefficient (R) of -0.461 and weighted average of 2.3%. Similarly, the statistical analysis conducted on geographies consisting of 178,415,520 people shows a slight positive correlation between the proportion of Creek and percentage of population with vision disability in the United States with a correlation coefficient (R) of 0.073 and weighted average of 3.2%, a difference of 40.8%.
Vision Disability Correlation Summary
| Measurement | Immigrants from Senegal | Creek |
| Minimum | 0.39% | 0.78% |
| Maximum | 3.3% | 11.5% |
| Range | 3.0% | 10.8% |
| Mean | 2.1% | 4.5% |
| Median | 2.2% | 3.8% |
| Interquartile 25% (IQ1) | 1.7% | 3.2% |
| Interquartile 75% (IQ3) | 2.6% | 5.4% |
| Interquartile Range (IQR) | 0.83% | 2.2% |
| Standard Deviation (Sample) | 0.68% | 2.3% |
| Standard Deviation (Population) | 0.67% | 2.3% |
Similar Demographics by Vision Disability
Demographics Similar to Immigrants from Senegal by Vision Disability
In terms of vision disability, the demographic groups most similar to Immigrants from Senegal are French Canadian (2.3%, a difference of 0.020%), Guamanian/Chamorro (2.3%, a difference of 0.040%), Basque (2.3%, a difference of 0.14%), Irish (2.3%, a difference of 0.17%), and Immigrants from Western Africa (2.3%, a difference of 0.18%).
| Demographics | Rating | Rank | Vision Disability |
| Nigerians | 7.2 /100 | #215 | Tragic 2.3% |
| Immigrants | Trinidad and Tobago | 6.1 /100 | #216 | Tragic 2.3% |
| Barbadians | 5.1 /100 | #217 | Tragic 2.3% |
| Portuguese | 4.9 /100 | #218 | Tragic 2.3% |
| Ecuadorians | 4.6 /100 | #219 | Tragic 2.3% |
| Guamanians/Chamorros | 3.9 /100 | #220 | Tragic 2.3% |
| French Canadians | 3.9 /100 | #221 | Tragic 2.3% |
| Immigrants | Senegal | 3.8 /100 | #222 | Tragic 2.3% |
| Basques | 3.5 /100 | #223 | Tragic 2.3% |
| Irish | 3.4 /100 | #224 | Tragic 2.3% |
| Immigrants | Western Africa | 3.4 /100 | #225 | Tragic 2.3% |
| Immigrants | Germany | 3.0 /100 | #226 | Tragic 2.3% |
| Hawaiians | 2.9 /100 | #227 | Tragic 2.3% |
| Hmong | 2.5 /100 | #228 | Tragic 2.3% |
| Welsh | 2.3 /100 | #229 | Tragic 2.3% |
Demographics Similar to Creek by Vision Disability
In terms of vision disability, the demographic groups most similar to Creek are Tsimshian (3.2%, a difference of 0.13%), Chickasaw (3.2%, a difference of 0.82%), Kiowa (3.3%, a difference of 1.4%), Dutch West Indian (3.2%, a difference of 1.7%), and Alaskan Athabascan (3.1%, a difference of 1.8%).
| Demographics | Rating | Rank | Vision Disability |
| Cajuns | 0.0 /100 | #333 | Tragic 3.1% |
| Cheyenne | 0.0 /100 | #334 | Tragic 3.1% |
| Navajo | 0.0 /100 | #335 | Tragic 3.1% |
| Alaskan Athabascans | 0.0 /100 | #336 | Tragic 3.1% |
| Dutch West Indians | 0.0 /100 | #337 | Tragic 3.2% |
| Chickasaw | 0.0 /100 | #338 | Tragic 3.2% |
| Tsimshian | 0.0 /100 | #339 | Tragic 3.2% |
| Creek | 0.0 /100 | #340 | Tragic 3.2% |
| Kiowa | 0.0 /100 | #341 | Tragic 3.3% |
| Choctaw | 0.0 /100 | #342 | Tragic 3.3% |
| Pima | 0.0 /100 | #343 | Tragic 3.3% |
| Pueblo | 0.0 /100 | #344 | Tragic 3.3% |
| Lumbee | 0.0 /100 | #345 | Tragic 3.4% |
| Houma | 0.0 /100 | #346 | Tragic 3.4% |
| Puerto Ricans | 0.0 /100 | #347 | Tragic 3.9% |