Immigrants from Peru vs Czechoslovakian Male Disability
COMPARE
Immigrants from Peru
Czechoslovakian
Male Disability
Male Disability Comparison
Immigrants from Peru
Czechoslovakians
10.3%
MALE DISABILITY
99.7/ 100
METRIC RATING
47th/ 347
METRIC RANK
12.3%
MALE DISABILITY
0.1/ 100
METRIC RATING
269th/ 347
METRIC RANK
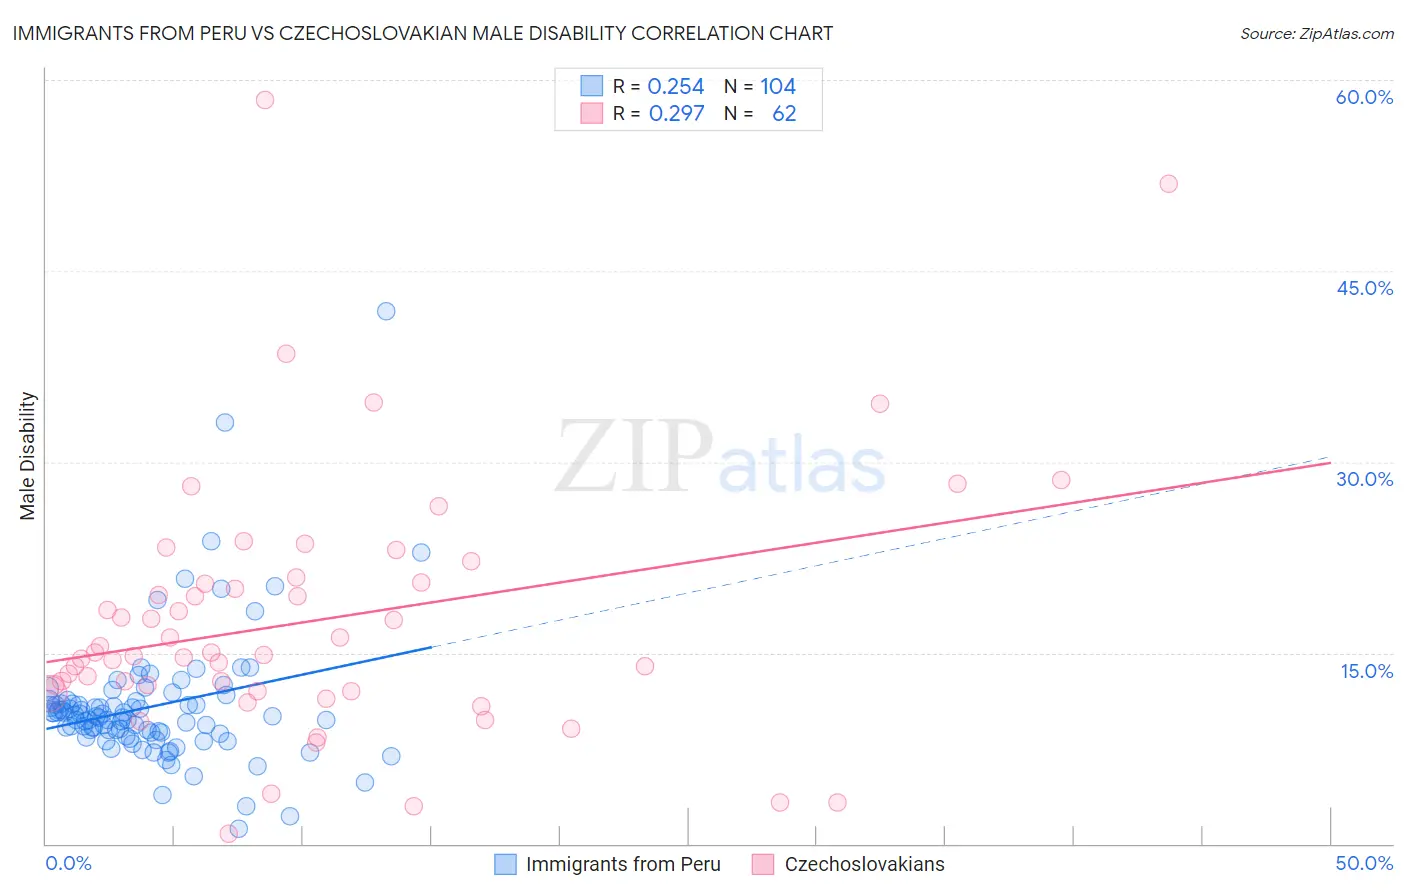
Immigrants from Peru vs Czechoslovakian Male Disability Correlation Chart
The statistical analysis conducted on geographies consisting of 328,831,517 people shows a weak positive correlation between the proportion of Immigrants from Peru and percentage of males with a disability in the United States with a correlation coefficient (R) of 0.254 and weighted average of 10.3%. Similarly, the statistical analysis conducted on geographies consisting of 368,653,122 people shows a weak positive correlation between the proportion of Czechoslovakians and percentage of males with a disability in the United States with a correlation coefficient (R) of 0.297 and weighted average of 12.3%, a difference of 19.1%.
Male Disability Correlation Summary
| Measurement | Immigrants from Peru | Czechoslovakian |
| Minimum | 1.2% | 0.83% |
| Maximum | 41.8% | 58.5% |
| Range | 40.6% | 57.6% |
| Mean | 10.8% | 17.5% |
| Median | 10.0% | 14.9% |
| Interquartile 25% (IQ1) | 8.7% | 12.0% |
| Interquartile 75% (IQ3) | 11.1% | 20.6% |
| Interquartile Range (IQR) | 2.4% | 8.5% |
| Standard Deviation (Sample) | 5.3% | 10.3% |
| Standard Deviation (Population) | 5.3% | 10.2% |
Similar Demographics by Male Disability
Demographics Similar to Immigrants from Peru by Male Disability
In terms of male disability, the demographic groups most similar to Immigrants from Peru are Israeli (10.3%, a difference of 0.030%), Cambodian (10.3%, a difference of 0.040%), Immigrants from Spain (10.3%, a difference of 0.090%), Immigrants from El Salvador (10.3%, a difference of 0.12%), and Turkish (10.3%, a difference of 0.12%).
| Demographics | Rating | Rank | Male Disability |
| Immigrants | Nepal | 99.8 /100 | #40 | Exceptional 10.3% |
| Taiwanese | 99.8 /100 | #41 | Exceptional 10.3% |
| Mongolians | 99.7 /100 | #42 | Exceptional 10.3% |
| Immigrants | Bangladesh | 99.7 /100 | #43 | Exceptional 10.3% |
| Immigrants | El Salvador | 99.7 /100 | #44 | Exceptional 10.3% |
| Turks | 99.7 /100 | #45 | Exceptional 10.3% |
| Cambodians | 99.7 /100 | #46 | Exceptional 10.3% |
| Immigrants | Peru | 99.7 /100 | #47 | Exceptional 10.3% |
| Israelis | 99.7 /100 | #48 | Exceptional 10.3% |
| Immigrants | Spain | 99.7 /100 | #49 | Exceptional 10.3% |
| South Americans | 99.6 /100 | #50 | Exceptional 10.3% |
| Salvadorans | 99.6 /100 | #51 | Exceptional 10.4% |
| Immigrants | Saudi Arabia | 99.6 /100 | #52 | Exceptional 10.4% |
| Immigrants | Uzbekistan | 99.6 /100 | #53 | Exceptional 10.4% |
| Peruvians | 99.6 /100 | #54 | Exceptional 10.4% |
Demographics Similar to Czechoslovakians by Male Disability
In terms of male disability, the demographic groups most similar to Czechoslovakians are Portuguese (12.3%, a difference of 0.0%), Spaniard (12.3%, a difference of 0.080%), Immigrants from Germany (12.3%, a difference of 0.13%), Hawaiian (12.3%, a difference of 0.18%), and Immigrants from Portugal (12.3%, a difference of 0.19%).
| Demographics | Rating | Rank | Male Disability |
| Norwegians | 0.2 /100 | #262 | Tragic 12.2% |
| Canadians | 0.2 /100 | #263 | Tragic 12.2% |
| Nepalese | 0.2 /100 | #264 | Tragic 12.2% |
| Immigrants | Portugal | 0.1 /100 | #265 | Tragic 12.3% |
| Hawaiians | 0.1 /100 | #266 | Tragic 12.3% |
| Immigrants | Germany | 0.1 /100 | #267 | Tragic 12.3% |
| Portuguese | 0.1 /100 | #268 | Tragic 12.3% |
| Czechoslovakians | 0.1 /100 | #269 | Tragic 12.3% |
| Spaniards | 0.1 /100 | #270 | Tragic 12.3% |
| Scandinavians | 0.1 /100 | #271 | Tragic 12.3% |
| Hmong | 0.0 /100 | #272 | Tragic 12.5% |
| Native Hawaiians | 0.0 /100 | #273 | Tragic 12.5% |
| Hopi | 0.0 /100 | #274 | Tragic 12.5% |
| Fijians | 0.0 /100 | #275 | Tragic 12.6% |
| Africans | 0.0 /100 | #276 | Tragic 12.6% |