Immigrants from Northern Africa vs Alsatian Female Disability
COMPARE
Immigrants from Northern Africa
Alsatian
Female Disability
Female Disability Comparison
Immigrants from Northern Africa
Alsatians
11.5%
FEMALE DISABILITY
99.8/ 100
METRIC RATING
68th/ 347
METRIC RANK
12.6%
FEMALE DISABILITY
2.5/ 100
METRIC RATING
244th/ 347
METRIC RANK
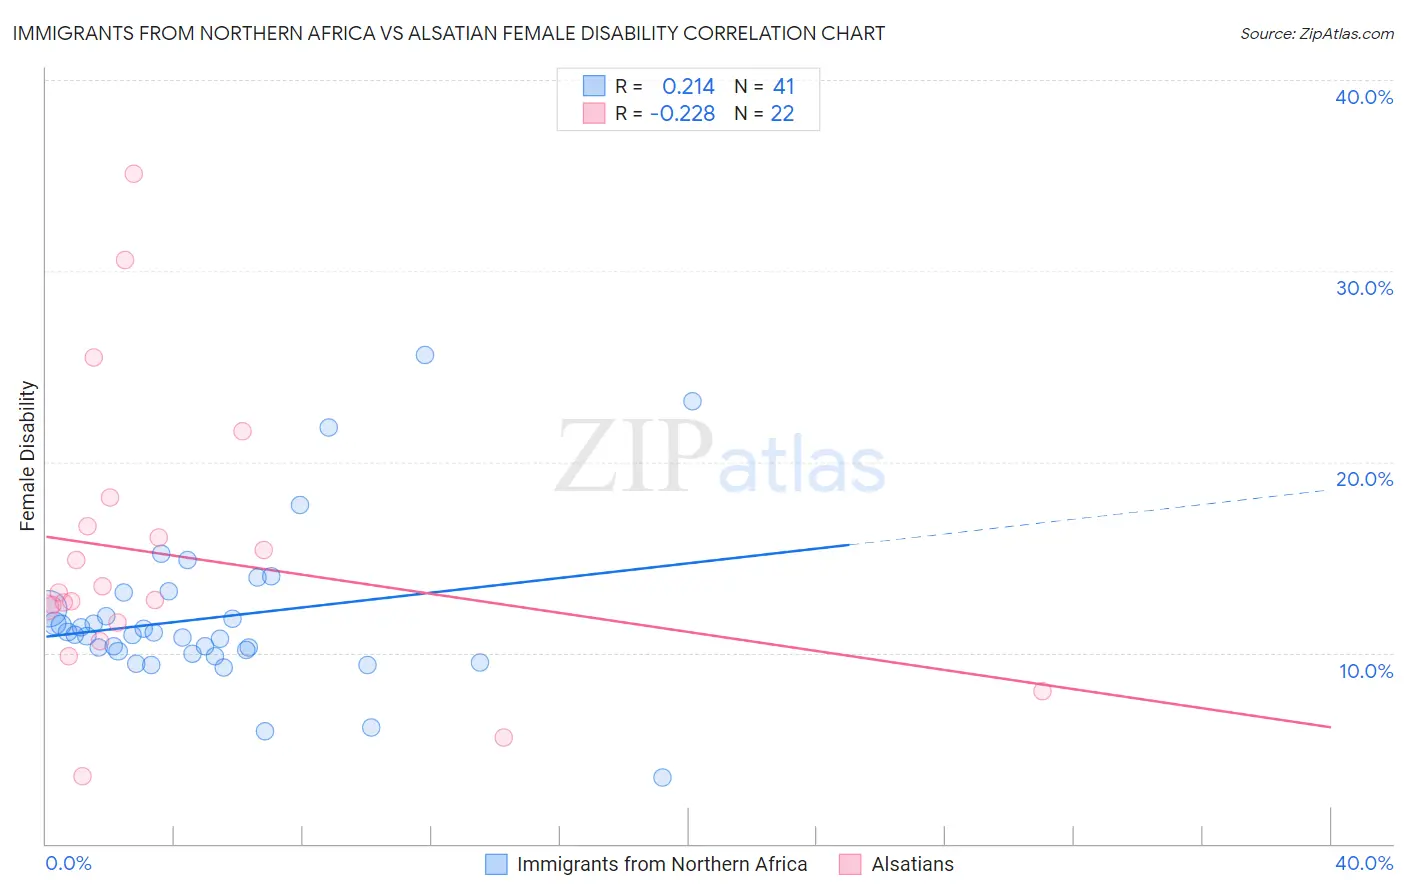
Immigrants from Northern Africa vs Alsatian Female Disability Correlation Chart
The statistical analysis conducted on geographies consisting of 321,175,054 people shows a weak positive correlation between the proportion of Immigrants from Northern Africa and percentage of females with a disability in the United States with a correlation coefficient (R) of 0.214 and weighted average of 11.5%. Similarly, the statistical analysis conducted on geographies consisting of 82,681,470 people shows a weak negative correlation between the proportion of Alsatians and percentage of females with a disability in the United States with a correlation coefficient (R) of -0.228 and weighted average of 12.6%, a difference of 10.0%.
Female Disability Correlation Summary
| Measurement | Immigrants from Northern Africa | Alsatian |
| Minimum | 3.5% | 3.5% |
| Maximum | 25.6% | 35.1% |
| Range | 22.1% | 31.5% |
| Mean | 11.8% | 15.1% |
| Median | 10.9% | 13.0% |
| Interquartile 25% (IQ1) | 10.0% | 11.6% |
| Interquartile 75% (IQ3) | 12.7% | 16.6% |
| Interquartile Range (IQR) | 2.7% | 5.1% |
| Standard Deviation (Sample) | 4.1% | 7.5% |
| Standard Deviation (Population) | 4.1% | 7.3% |
Similar Demographics by Female Disability
Demographics Similar to Immigrants from Northern Africa by Female Disability
In terms of female disability, the demographic groups most similar to Immigrants from Northern Africa are Immigrants from Vietnam (11.5%, a difference of 0.020%), Salvadoran (11.5%, a difference of 0.060%), Colombian (11.5%, a difference of 0.070%), Immigrants from Chile (11.5%, a difference of 0.080%), and Immigrants from Ireland (11.5%, a difference of 0.13%).
| Demographics | Rating | Rank | Female Disability |
| Immigrants | France | 99.9 /100 | #61 | Exceptional 11.4% |
| Sri Lankans | 99.9 /100 | #62 | Exceptional 11.4% |
| Immigrants | Colombia | 99.9 /100 | #63 | Exceptional 11.4% |
| Immigrants | El Salvador | 99.9 /100 | #64 | Exceptional 11.4% |
| Immigrants | South America | 99.9 /100 | #65 | Exceptional 11.4% |
| Salvadorans | 99.8 /100 | #66 | Exceptional 11.5% |
| Immigrants | Vietnam | 99.8 /100 | #67 | Exceptional 11.5% |
| Immigrants | Northern Africa | 99.8 /100 | #68 | Exceptional 11.5% |
| Colombians | 99.8 /100 | #69 | Exceptional 11.5% |
| Immigrants | Chile | 99.8 /100 | #70 | Exceptional 11.5% |
| Immigrants | Ireland | 99.8 /100 | #71 | Exceptional 11.5% |
| Chileans | 99.8 /100 | #72 | Exceptional 11.5% |
| Immigrants | Switzerland | 99.8 /100 | #73 | Exceptional 11.5% |
| Bhutanese | 99.8 /100 | #74 | Exceptional 11.5% |
| Immigrants | Lebanon | 99.7 /100 | #75 | Exceptional 11.5% |
Demographics Similar to Alsatians by Female Disability
In terms of female disability, the demographic groups most similar to Alsatians are Immigrants from Senegal (12.6%, a difference of 0.010%), Canadian (12.6%, a difference of 0.020%), Japanese (12.6%, a difference of 0.070%), Immigrants from Jamaica (12.6%, a difference of 0.14%), and Spanish American Indian (12.6%, a difference of 0.15%).
| Demographics | Rating | Rank | Female Disability |
| Slavs | 3.8 /100 | #237 | Tragic 12.6% |
| Yugoslavians | 3.7 /100 | #238 | Tragic 12.6% |
| Barbadians | 3.6 /100 | #239 | Tragic 12.6% |
| German Russians | 3.2 /100 | #240 | Tragic 12.6% |
| Japanese | 2.7 /100 | #241 | Tragic 12.6% |
| Canadians | 2.6 /100 | #242 | Tragic 12.6% |
| Immigrants | Senegal | 2.5 /100 | #243 | Tragic 12.6% |
| Alsatians | 2.5 /100 | #244 | Tragic 12.6% |
| Immigrants | Jamaica | 2.2 /100 | #245 | Tragic 12.6% |
| Spanish American Indians | 2.1 /100 | #246 | Tragic 12.6% |
| Menominee | 2.1 /100 | #247 | Tragic 12.6% |
| Carpatho Rusyns | 2.0 /100 | #248 | Tragic 12.6% |
| Immigrants | Congo | 1.8 /100 | #249 | Tragic 12.7% |
| Slovenes | 1.7 /100 | #250 | Tragic 12.7% |
| Crow | 1.6 /100 | #251 | Tragic 12.7% |