Immigrants from Kazakhstan vs Okinawan Cognitive Disability
COMPARE
Immigrants from Kazakhstan
Okinawan
Cognitive Disability
Cognitive Disability Comparison
Immigrants from Kazakhstan
Okinawans
17.1%
COGNITIVE DISABILITY
80.5/ 100
METRIC RATING
153rd/ 347
METRIC RANK
17.6%
COGNITIVE DISABILITY
6.8/ 100
METRIC RATING
216th/ 347
METRIC RANK
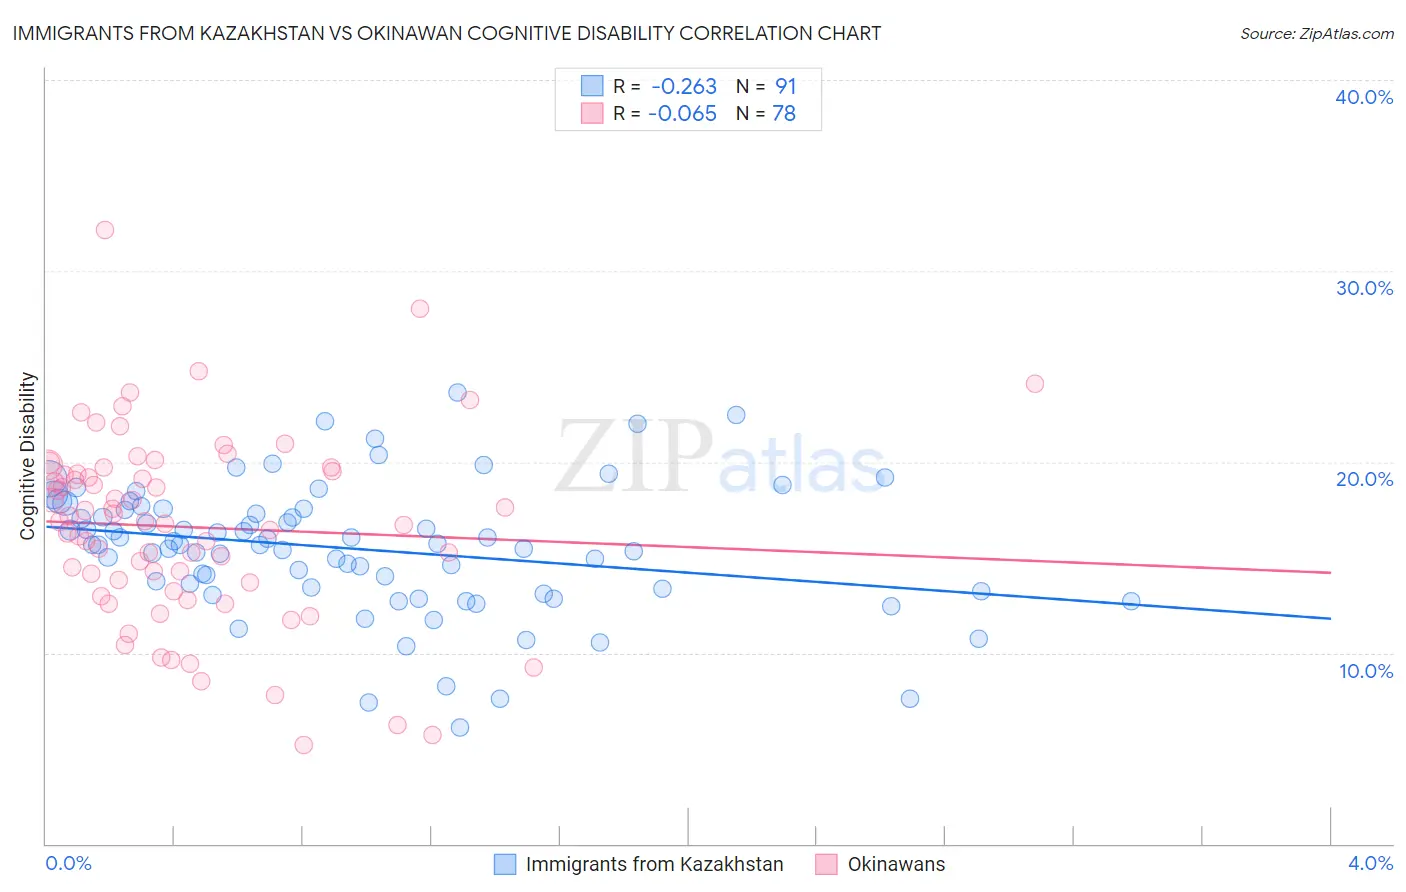
Immigrants from Kazakhstan vs Okinawan Cognitive Disability Correlation Chart
The statistical analysis conducted on geographies consisting of 124,443,744 people shows a weak negative correlation between the proportion of Immigrants from Kazakhstan and percentage of population with cognitive disability in the United States with a correlation coefficient (R) of -0.263 and weighted average of 17.1%. Similarly, the statistical analysis conducted on geographies consisting of 73,776,051 people shows a slight negative correlation between the proportion of Okinawans and percentage of population with cognitive disability in the United States with a correlation coefficient (R) of -0.065 and weighted average of 17.6%, a difference of 2.9%.
Cognitive Disability Correlation Summary
| Measurement | Immigrants from Kazakhstan | Okinawan |
| Minimum | 6.1% | 5.1% |
| Maximum | 23.7% | 32.1% |
| Range | 17.6% | 27.0% |
| Mean | 15.5% | 16.6% |
| Median | 15.7% | 16.9% |
| Interquartile 25% (IQ1) | 13.4% | 13.7% |
| Interquartile 75% (IQ3) | 17.5% | 19.5% |
| Interquartile Range (IQR) | 4.2% | 5.8% |
| Standard Deviation (Sample) | 3.4% | 4.9% |
| Standard Deviation (Population) | 3.4% | 4.9% |
Similar Demographics by Cognitive Disability
Demographics Similar to Immigrants from Kazakhstan by Cognitive Disability
In terms of cognitive disability, the demographic groups most similar to Immigrants from Kazakhstan are Immigrants from Malaysia (17.1%, a difference of 0.050%), Brazilian (17.1%, a difference of 0.070%), Sri Lankan (17.1%, a difference of 0.070%), Immigrants from Indonesia (17.1%, a difference of 0.10%), and Syrian (17.1%, a difference of 0.12%).
| Demographics | Rating | Rank | Cognitive Disability |
| Costa Ricans | 88.0 /100 | #146 | Excellent 17.0% |
| Scotch-Irish | 85.9 /100 | #147 | Excellent 17.1% |
| French Canadians | 85.7 /100 | #148 | Excellent 17.1% |
| Cypriots | 85.7 /100 | #149 | Excellent 17.1% |
| Basques | 85.5 /100 | #150 | Excellent 17.1% |
| Syrians | 83.0 /100 | #151 | Excellent 17.1% |
| Immigrants | Indonesia | 82.7 /100 | #152 | Excellent 17.1% |
| Immigrants | Kazakhstan | 80.5 /100 | #153 | Excellent 17.1% |
| Immigrants | Malaysia | 79.3 /100 | #154 | Good 17.1% |
| Brazilians | 78.9 /100 | #155 | Good 17.1% |
| Sri Lankans | 78.9 /100 | #156 | Good 17.1% |
| Immigrants | Australia | 76.0 /100 | #157 | Good 17.1% |
| Celtics | 74.1 /100 | #158 | Good 17.1% |
| Immigrants | Latvia | 73.2 /100 | #159 | Good 17.2% |
| Australians | 72.4 /100 | #160 | Good 17.2% |
Demographics Similar to Okinawans by Cognitive Disability
In terms of cognitive disability, the demographic groups most similar to Okinawans are Alaskan Athabascan (17.6%, a difference of 0.010%), Immigrants from El Salvador (17.6%, a difference of 0.020%), Salvadoran (17.6%, a difference of 0.020%), Hawaiian (17.6%, a difference of 0.040%), and Immigrants from Oceania (17.6%, a difference of 0.050%).
| Demographics | Rating | Rank | Cognitive Disability |
| Immigrants | Trinidad and Tobago | 8.7 /100 | #209 | Tragic 17.6% |
| Immigrants | Jamaica | 8.5 /100 | #210 | Tragic 17.6% |
| Taiwanese | 7.7 /100 | #211 | Tragic 17.6% |
| Immigrants | Oceania | 7.3 /100 | #212 | Tragic 17.6% |
| Hawaiians | 7.2 /100 | #213 | Tragic 17.6% |
| Immigrants | El Salvador | 7.0 /100 | #214 | Tragic 17.6% |
| Alaskan Athabascans | 6.9 /100 | #215 | Tragic 17.6% |
| Okinawans | 6.8 /100 | #216 | Tragic 17.6% |
| Salvadorans | 6.7 /100 | #217 | Tragic 17.6% |
| Icelanders | 6.4 /100 | #218 | Tragic 17.6% |
| Immigrants | Sierra Leone | 6.3 /100 | #219 | Tragic 17.6% |
| Zimbabweans | 6.1 /100 | #220 | Tragic 17.6% |
| Moroccans | 5.9 /100 | #221 | Tragic 17.6% |
| Central Americans | 4.5 /100 | #222 | Tragic 17.7% |
| Alsatians | 4.5 /100 | #223 | Tragic 17.7% |