Immigrants from Czechoslovakia vs Okinawan Cognitive Disability
COMPARE
Immigrants from Czechoslovakia
Okinawan
Cognitive Disability
Cognitive Disability Comparison
Immigrants from Czechoslovakia
Okinawans
16.2%
COGNITIVE DISABILITY
100.0/ 100
METRIC RATING
11th/ 347
METRIC RANK
17.6%
COGNITIVE DISABILITY
6.8/ 100
METRIC RATING
216th/ 347
METRIC RANK
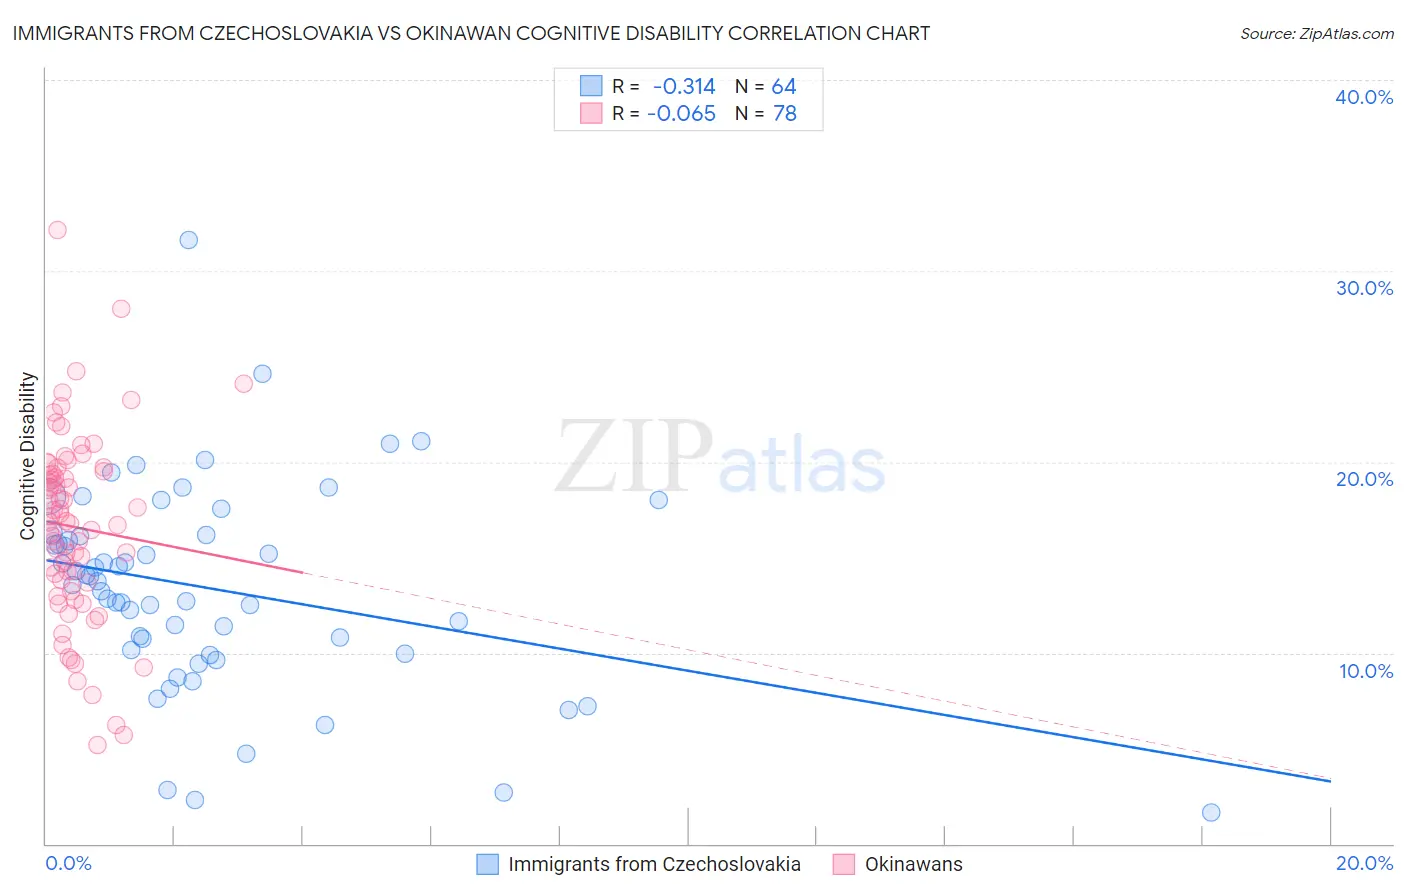
Immigrants from Czechoslovakia vs Okinawan Cognitive Disability Correlation Chart
The statistical analysis conducted on geographies consisting of 195,454,125 people shows a mild negative correlation between the proportion of Immigrants from Czechoslovakia and percentage of population with cognitive disability in the United States with a correlation coefficient (R) of -0.314 and weighted average of 16.2%. Similarly, the statistical analysis conducted on geographies consisting of 73,776,051 people shows a slight negative correlation between the proportion of Okinawans and percentage of population with cognitive disability in the United States with a correlation coefficient (R) of -0.065 and weighted average of 17.6%, a difference of 8.6%.
Cognitive Disability Correlation Summary
| Measurement | Immigrants from Czechoslovakia | Okinawan |
| Minimum | 1.7% | 5.1% |
| Maximum | 31.6% | 32.1% |
| Range | 30.0% | 27.0% |
| Mean | 13.3% | 16.6% |
| Median | 13.6% | 16.9% |
| Interquartile 25% (IQ1) | 10.1% | 13.7% |
| Interquartile 75% (IQ3) | 16.1% | 19.5% |
| Interquartile Range (IQR) | 6.1% | 5.8% |
| Standard Deviation (Sample) | 5.4% | 4.9% |
| Standard Deviation (Population) | 5.3% | 4.9% |
Similar Demographics by Cognitive Disability
Demographics Similar to Immigrants from Czechoslovakia by Cognitive Disability
In terms of cognitive disability, the demographic groups most similar to Immigrants from Czechoslovakia are Immigrants from Scotland (16.2%, a difference of 0.080%), Assyrian/Chaldean/Syriac (16.2%, a difference of 0.13%), Maltese (16.2%, a difference of 0.16%), Lithuanian (16.3%, a difference of 0.25%), and Immigrants from Austria (16.3%, a difference of 0.31%).
| Demographics | Rating | Rank | Cognitive Disability |
| Immigrants | Lithuania | 100.0 /100 | #4 | Exceptional 16.0% |
| Immigrants | Hong Kong | 100.0 /100 | #5 | Exceptional 16.0% |
| Thais | 100.0 /100 | #6 | Exceptional 16.1% |
| Immigrants | Ireland | 100.0 /100 | #7 | Exceptional 16.1% |
| Immigrants | Poland | 100.0 /100 | #8 | Exceptional 16.1% |
| Assyrians/Chaldeans/Syriacs | 100.0 /100 | #9 | Exceptional 16.2% |
| Immigrants | Scotland | 100.0 /100 | #10 | Exceptional 16.2% |
| Immigrants | Czechoslovakia | 100.0 /100 | #11 | Exceptional 16.2% |
| Maltese | 100.0 /100 | #12 | Exceptional 16.2% |
| Lithuanians | 100.0 /100 | #13 | Exceptional 16.3% |
| Immigrants | Austria | 100.0 /100 | #14 | Exceptional 16.3% |
| Immigrants | Greece | 100.0 /100 | #15 | Exceptional 16.3% |
| Eastern Europeans | 100.0 /100 | #16 | Exceptional 16.3% |
| Immigrants | North Macedonia | 100.0 /100 | #17 | Exceptional 16.3% |
| Immigrants | Northern Europe | 100.0 /100 | #18 | Exceptional 16.3% |
Demographics Similar to Okinawans by Cognitive Disability
In terms of cognitive disability, the demographic groups most similar to Okinawans are Alaskan Athabascan (17.6%, a difference of 0.010%), Immigrants from El Salvador (17.6%, a difference of 0.020%), Salvadoran (17.6%, a difference of 0.020%), Hawaiian (17.6%, a difference of 0.040%), and Immigrants from Oceania (17.6%, a difference of 0.050%).
| Demographics | Rating | Rank | Cognitive Disability |
| Immigrants | Trinidad and Tobago | 8.7 /100 | #209 | Tragic 17.6% |
| Immigrants | Jamaica | 8.5 /100 | #210 | Tragic 17.6% |
| Taiwanese | 7.7 /100 | #211 | Tragic 17.6% |
| Immigrants | Oceania | 7.3 /100 | #212 | Tragic 17.6% |
| Hawaiians | 7.2 /100 | #213 | Tragic 17.6% |
| Immigrants | El Salvador | 7.0 /100 | #214 | Tragic 17.6% |
| Alaskan Athabascans | 6.9 /100 | #215 | Tragic 17.6% |
| Okinawans | 6.8 /100 | #216 | Tragic 17.6% |
| Salvadorans | 6.7 /100 | #217 | Tragic 17.6% |
| Icelanders | 6.4 /100 | #218 | Tragic 17.6% |
| Immigrants | Sierra Leone | 6.3 /100 | #219 | Tragic 17.6% |
| Zimbabweans | 6.1 /100 | #220 | Tragic 17.6% |
| Moroccans | 5.9 /100 | #221 | Tragic 17.6% |
| Central Americans | 4.5 /100 | #222 | Tragic 17.7% |
| Alsatians | 4.5 /100 | #223 | Tragic 17.7% |