Immigrants from Italy vs Kiowa Vision Disability
COMPARE
Immigrants from Italy
Kiowa
Vision Disability
Vision Disability Comparison
Immigrants from Italy
Kiowa
2.1%
VISION DISABILITY
94.4/ 100
METRIC RATING
104th/ 347
METRIC RANK
3.3%
VISION DISABILITY
0.0/ 100
METRIC RATING
341st/ 347
METRIC RANK
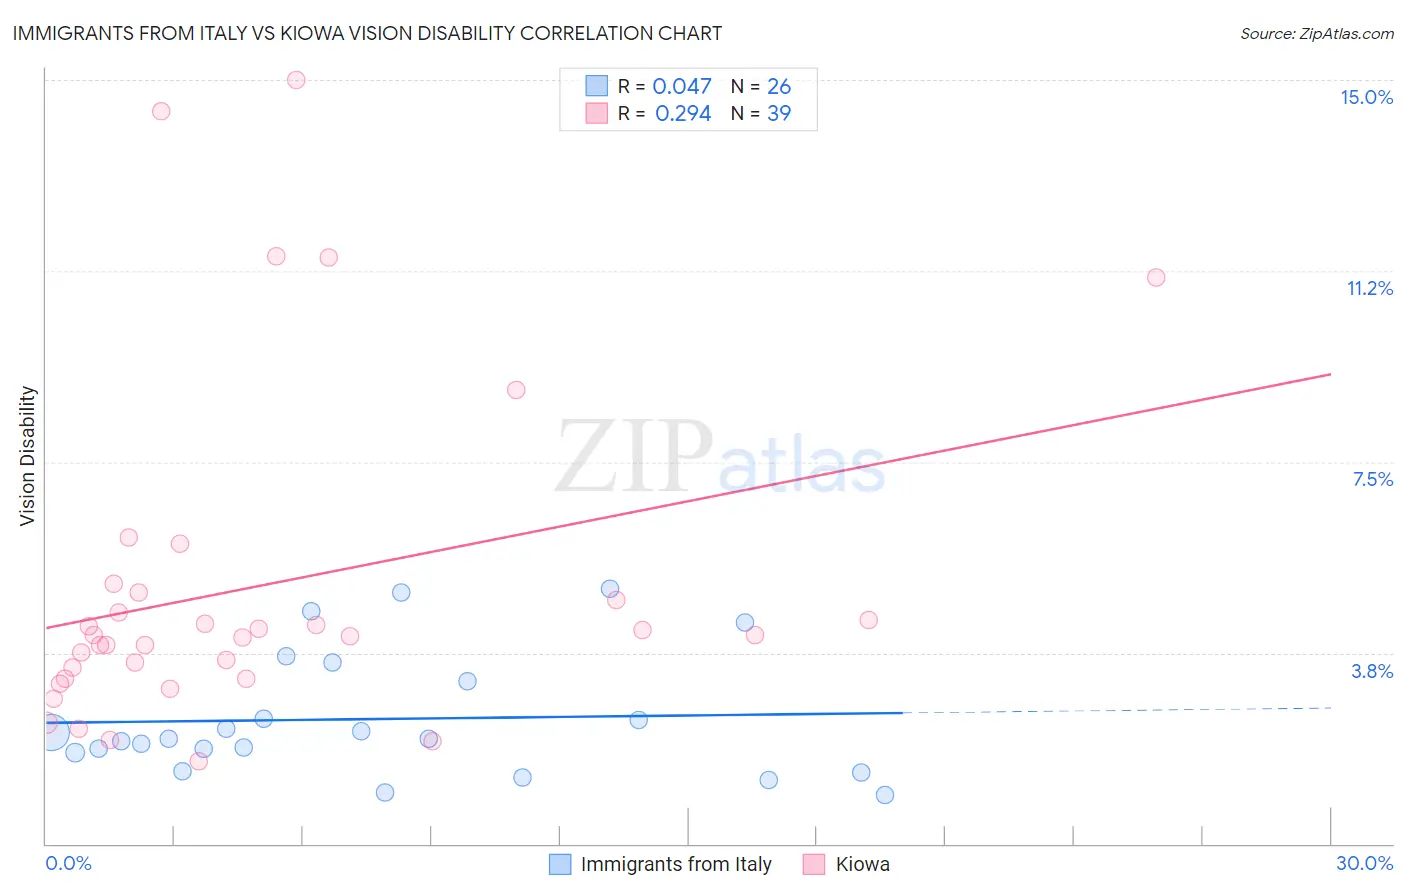
Immigrants from Italy vs Kiowa Vision Disability Correlation Chart
The statistical analysis conducted on geographies consisting of 323,994,035 people shows no correlation between the proportion of Immigrants from Italy and percentage of population with vision disability in the United States with a correlation coefficient (R) of 0.047 and weighted average of 2.1%. Similarly, the statistical analysis conducted on geographies consisting of 56,085,396 people shows a weak positive correlation between the proportion of Kiowa and percentage of population with vision disability in the United States with a correlation coefficient (R) of 0.294 and weighted average of 3.3%, a difference of 57.1%.
Vision Disability Correlation Summary
| Measurement | Immigrants from Italy | Kiowa |
| Minimum | 0.96% | 1.6% |
| Maximum | 5.0% | 15.0% |
| Range | 4.0% | 13.4% |
| Mean | 2.4% | 5.1% |
| Median | 2.1% | 4.1% |
| Interquartile 25% (IQ1) | 1.8% | 3.2% |
| Interquartile 75% (IQ3) | 3.2% | 4.9% |
| Interquartile Range (IQR) | 1.4% | 1.7% |
| Standard Deviation (Sample) | 1.2% | 3.3% |
| Standard Deviation (Population) | 1.2% | 3.2% |
Similar Demographics by Vision Disability
Demographics Similar to Immigrants from Italy by Vision Disability
In terms of vision disability, the demographic groups most similar to Immigrants from Italy are Immigrants from Austria (2.1%, a difference of 0.010%), Carpatho Rusyn (2.1%, a difference of 0.010%), Swedish (2.1%, a difference of 0.060%), Danish (2.1%, a difference of 0.060%), and Korean (2.1%, a difference of 0.090%).
| Demographics | Rating | Rank | Vision Disability |
| Immigrants | Afghanistan | 95.6 /100 | #97 | Exceptional 2.1% |
| Immigrants | South Africa | 95.4 /100 | #98 | Exceptional 2.1% |
| Estonians | 95.3 /100 | #99 | Exceptional 2.1% |
| Greeks | 95.1 /100 | #100 | Exceptional 2.1% |
| Albanians | 94.9 /100 | #101 | Exceptional 2.1% |
| Sri Lankans | 94.8 /100 | #102 | Exceptional 2.1% |
| Immigrants | Austria | 94.4 /100 | #103 | Exceptional 2.1% |
| Immigrants | Italy | 94.4 /100 | #104 | Exceptional 2.1% |
| Carpatho Rusyns | 94.3 /100 | #105 | Exceptional 2.1% |
| Swedes | 94.2 /100 | #106 | Exceptional 2.1% |
| Danes | 94.2 /100 | #107 | Exceptional 2.1% |
| Koreans | 94.1 /100 | #108 | Exceptional 2.1% |
| Chileans | 94.0 /100 | #109 | Exceptional 2.1% |
| Immigrants | Armenia | 93.8 /100 | #110 | Exceptional 2.1% |
| Peruvians | 93.5 /100 | #111 | Exceptional 2.1% |
Demographics Similar to Kiowa by Vision Disability
In terms of vision disability, the demographic groups most similar to Kiowa are Choctaw (3.3%, a difference of 1.4%), Creek (3.2%, a difference of 1.4%), Tsimshian (3.2%, a difference of 1.6%), Chickasaw (3.2%, a difference of 2.3%), and Pima (3.3%, a difference of 2.5%).
| Demographics | Rating | Rank | Vision Disability |
| Cajuns | 0.0 /100 | #333 | Tragic 3.1% |
| Cheyenne | 0.0 /100 | #334 | Tragic 3.1% |
| Navajo | 0.0 /100 | #335 | Tragic 3.1% |
| Alaskan Athabascans | 0.0 /100 | #336 | Tragic 3.1% |
| Dutch West Indians | 0.0 /100 | #337 | Tragic 3.2% |
| Chickasaw | 0.0 /100 | #338 | Tragic 3.2% |
| Tsimshian | 0.0 /100 | #339 | Tragic 3.2% |
| Creek | 0.0 /100 | #340 | Tragic 3.2% |
| Kiowa | 0.0 /100 | #341 | Tragic 3.3% |
| Choctaw | 0.0 /100 | #342 | Tragic 3.3% |
| Pima | 0.0 /100 | #343 | Tragic 3.3% |
| Pueblo | 0.0 /100 | #344 | Tragic 3.3% |
| Lumbee | 0.0 /100 | #345 | Tragic 3.4% |
| Houma | 0.0 /100 | #346 | Tragic 3.4% |
| Puerto Ricans | 0.0 /100 | #347 | Tragic 3.9% |