Immigrants from Iraq vs Ute Male Disability
COMPARE
Immigrants from Iraq
Ute
Male Disability
Male Disability Comparison
Immigrants from Iraq
Ute
11.5%
MALE DISABILITY
13.0/ 100
METRIC RATING
200th/ 347
METRIC RANK
11.6%
MALE DISABILITY
9.4/ 100
METRIC RATING
210th/ 347
METRIC RANK
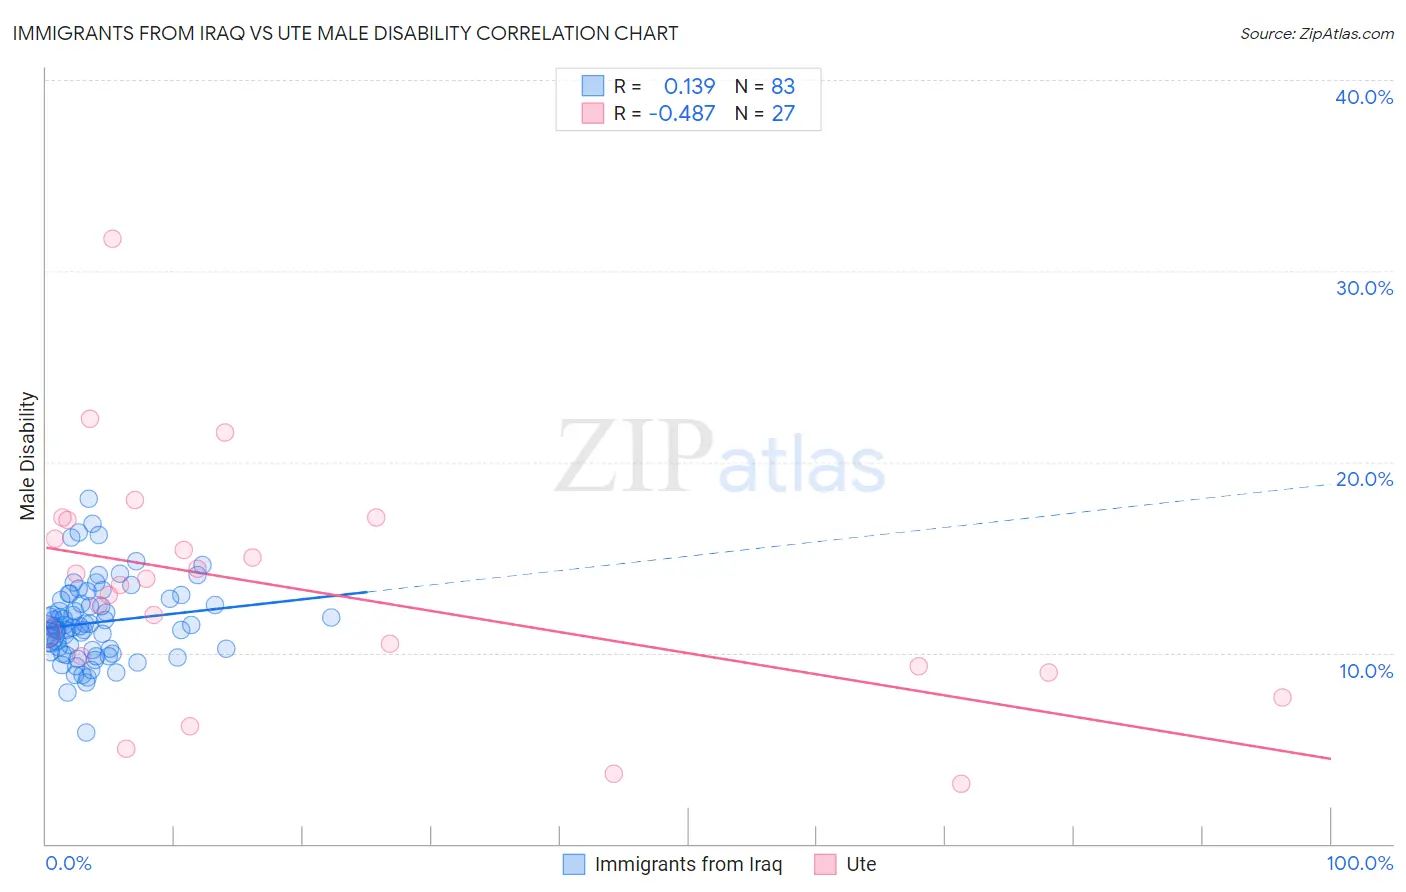
Immigrants from Iraq vs Ute Male Disability Correlation Chart
The statistical analysis conducted on geographies consisting of 194,768,899 people shows a poor positive correlation between the proportion of Immigrants from Iraq and percentage of males with a disability in the United States with a correlation coefficient (R) of 0.139 and weighted average of 11.5%. Similarly, the statistical analysis conducted on geographies consisting of 55,667,753 people shows a moderate negative correlation between the proportion of Ute and percentage of males with a disability in the United States with a correlation coefficient (R) of -0.487 and weighted average of 11.6%, a difference of 0.48%.
Male Disability Correlation Summary
| Measurement | Immigrants from Iraq | Ute |
| Minimum | 5.8% | 3.1% |
| Maximum | 18.1% | 31.7% |
| Range | 12.2% | 28.5% |
| Mean | 11.6% | 13.3% |
| Median | 11.4% | 13.6% |
| Interquartile 25% (IQ1) | 10.2% | 9.3% |
| Interquartile 75% (IQ3) | 12.8% | 16.9% |
| Interquartile Range (IQR) | 2.6% | 7.6% |
| Standard Deviation (Sample) | 2.1% | 6.1% |
| Standard Deviation (Population) | 2.1% | 6.0% |
Demographics Similar to Immigrants from Iraq and Ute by Male Disability
In terms of male disability, the demographic groups most similar to Immigrants from Iraq are Immigrants from Panama (11.5%, a difference of 0.0%), Immigrants from Mexico (11.5%, a difference of 0.040%), Lebanese (11.5%, a difference of 0.27%), Jamaican (11.5%, a difference of 0.27%), and Immigrants from Cambodia (11.5%, a difference of 0.29%). Similarly, the demographic groups most similar to Ute are Spanish American Indian (11.6%, a difference of 0.10%), Icelander (11.6%, a difference of 0.11%), Immigrants from Somalia (11.5%, a difference of 0.15%), Immigrants from Thailand (11.6%, a difference of 0.17%), and Ukrainian (11.5%, a difference of 0.18%).
| Demographics | Rating | Rank | Male Disability |
| Immigrants | Oceania | 20.9 /100 | #195 | Fair 11.4% |
| West Indians | 18.4 /100 | #196 | Poor 11.4% |
| Somalis | 18.2 /100 | #197 | Poor 11.4% |
| Immigrants | Jamaica | 16.3 /100 | #198 | Poor 11.5% |
| Lebanese | 15.4 /100 | #199 | Poor 11.5% |
| Immigrants | Iraq | 13.0 /100 | #200 | Poor 11.5% |
| Immigrants | Panama | 13.0 /100 | #201 | Poor 11.5% |
| Immigrants | Mexico | 12.6 /100 | #202 | Poor 11.5% |
| Jamaicans | 10.9 /100 | #203 | Poor 11.5% |
| Immigrants | Cambodia | 10.8 /100 | #204 | Poor 11.5% |
| Serbians | 10.7 /100 | #205 | Poor 11.5% |
| Ukrainians | 10.6 /100 | #206 | Poor 11.5% |
| Immigrants | Somalia | 10.4 /100 | #207 | Poor 11.5% |
| Icelanders | 10.1 /100 | #208 | Poor 11.6% |
| Spanish American Indians | 10.1 /100 | #209 | Poor 11.6% |
| Ute | 9.4 /100 | #210 | Tragic 11.6% |
| Immigrants | Thailand | 8.4 /100 | #211 | Tragic 11.6% |
| Immigrants | Scotland | 8.2 /100 | #212 | Tragic 11.6% |
| Mexican American Indians | 7.8 /100 | #213 | Tragic 11.6% |
| Lithuanians | 6.6 /100 | #214 | Tragic 11.6% |
| Indonesians | 5.9 /100 | #215 | Tragic 11.6% |