Immigrants from France vs Ute Male Disability
COMPARE
Immigrants from France
Ute
Male Disability
Male Disability Comparison
Immigrants from France
Ute
10.6%
MALE DISABILITY
97.6/ 100
METRIC RATING
91st/ 347
METRIC RANK
11.6%
MALE DISABILITY
9.4/ 100
METRIC RATING
210th/ 347
METRIC RANK
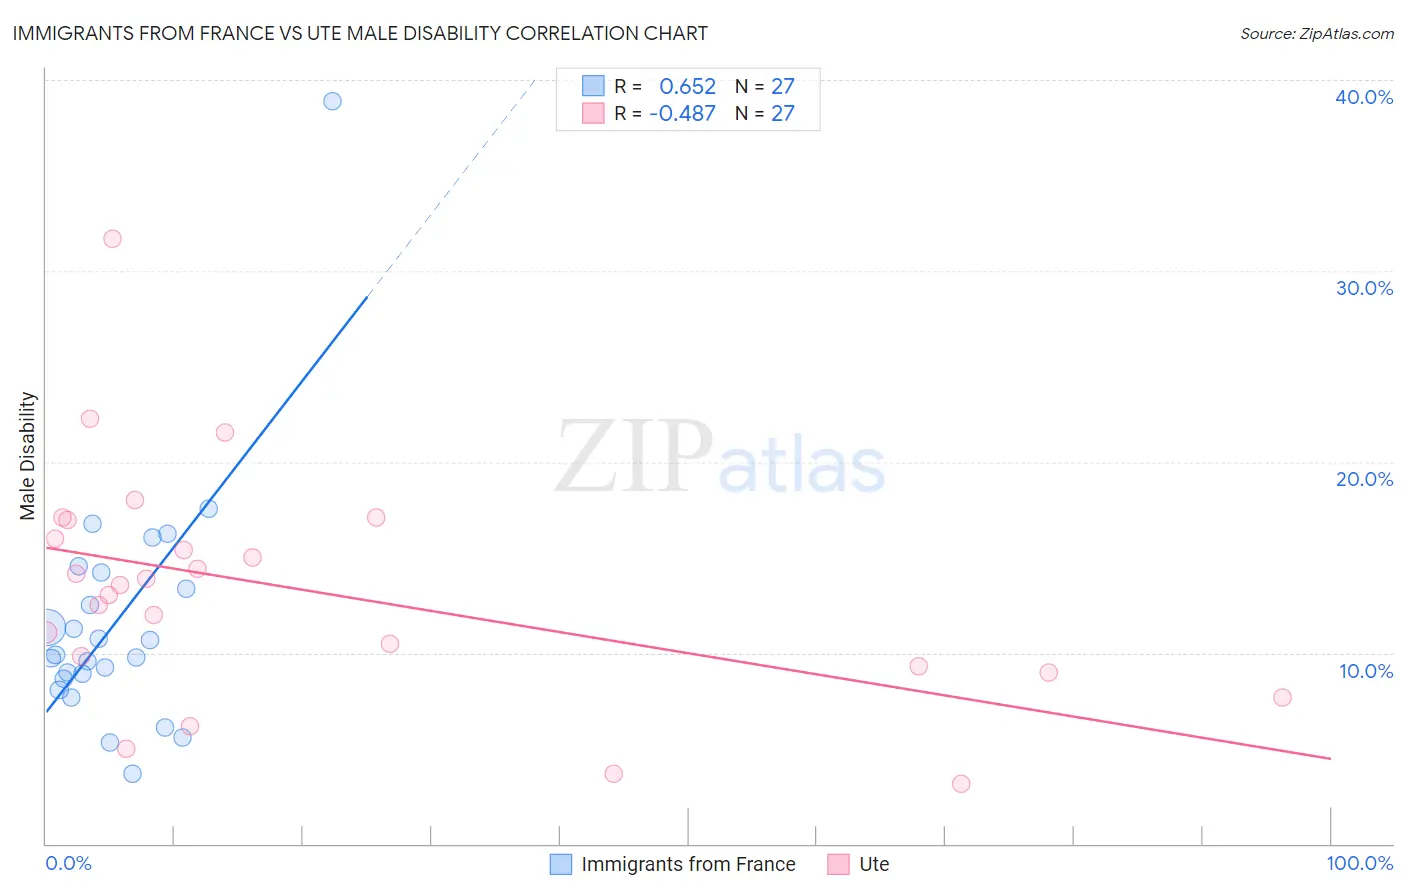
Immigrants from France vs Ute Male Disability Correlation Chart
The statistical analysis conducted on geographies consisting of 287,902,577 people shows a significant positive correlation between the proportion of Immigrants from France and percentage of males with a disability in the United States with a correlation coefficient (R) of 0.652 and weighted average of 10.6%. Similarly, the statistical analysis conducted on geographies consisting of 55,667,753 people shows a moderate negative correlation between the proportion of Ute and percentage of males with a disability in the United States with a correlation coefficient (R) of -0.487 and weighted average of 11.6%, a difference of 8.7%.
Male Disability Correlation Summary
| Measurement | Immigrants from France | Ute |
| Minimum | 3.6% | 3.1% |
| Maximum | 38.9% | 31.7% |
| Range | 35.3% | 28.5% |
| Mean | 11.7% | 13.3% |
| Median | 9.9% | 13.6% |
| Interquartile 25% (IQ1) | 8.6% | 9.3% |
| Interquartile 75% (IQ3) | 14.2% | 16.9% |
| Interquartile Range (IQR) | 5.6% | 7.6% |
| Standard Deviation (Sample) | 6.5% | 6.1% |
| Standard Deviation (Population) | 6.4% | 6.0% |
Similar Demographics by Male Disability
Demographics Similar to Immigrants from France by Male Disability
In terms of male disability, the demographic groups most similar to Immigrants from France are Immigrants from Morocco (10.6%, a difference of 0.040%), Immigrants from Western Asia (10.6%, a difference of 0.090%), Immigrants from Nicaragua (10.6%, a difference of 0.090%), Palestinian (10.7%, a difference of 0.15%), and Immigrants from Vietnam (10.6%, a difference of 0.16%).
| Demographics | Rating | Rank | Male Disability |
| Bulgarians | 98.1 /100 | #84 | Exceptional 10.6% |
| Sri Lankans | 97.9 /100 | #85 | Exceptional 10.6% |
| Immigrants | Ireland | 97.9 /100 | #86 | Exceptional 10.6% |
| Immigrants | Vietnam | 97.9 /100 | #87 | Exceptional 10.6% |
| Immigrants | Western Asia | 97.8 /100 | #88 | Exceptional 10.6% |
| Immigrants | Nicaragua | 97.8 /100 | #89 | Exceptional 10.6% |
| Immigrants | Morocco | 97.7 /100 | #90 | Exceptional 10.6% |
| Immigrants | France | 97.6 /100 | #91 | Exceptional 10.6% |
| Palestinians | 97.4 /100 | #92 | Exceptional 10.7% |
| Immigrants | St. Vincent and the Grenadines | 97.1 /100 | #93 | Exceptional 10.7% |
| Immigrants | Sweden | 96.9 /100 | #94 | Exceptional 10.7% |
| Chileans | 96.9 /100 | #95 | Exceptional 10.7% |
| Nicaraguans | 96.6 /100 | #96 | Exceptional 10.7% |
| Immigrants | Armenia | 96.6 /100 | #97 | Exceptional 10.7% |
| Immigrants | Romania | 96.5 /100 | #98 | Exceptional 10.7% |
Demographics Similar to Ute by Male Disability
In terms of male disability, the demographic groups most similar to Ute are Spanish American Indian (11.6%, a difference of 0.10%), Icelander (11.6%, a difference of 0.11%), Immigrants from Somalia (11.5%, a difference of 0.15%), Immigrants from Thailand (11.6%, a difference of 0.17%), and Ukrainian (11.5%, a difference of 0.18%).
| Demographics | Rating | Rank | Male Disability |
| Jamaicans | 10.9 /100 | #203 | Poor 11.5% |
| Immigrants | Cambodia | 10.8 /100 | #204 | Poor 11.5% |
| Serbians | 10.7 /100 | #205 | Poor 11.5% |
| Ukrainians | 10.6 /100 | #206 | Poor 11.5% |
| Immigrants | Somalia | 10.4 /100 | #207 | Poor 11.5% |
| Icelanders | 10.1 /100 | #208 | Poor 11.6% |
| Spanish American Indians | 10.1 /100 | #209 | Poor 11.6% |
| Ute | 9.4 /100 | #210 | Tragic 11.6% |
| Immigrants | Thailand | 8.4 /100 | #211 | Tragic 11.6% |
| Immigrants | Scotland | 8.2 /100 | #212 | Tragic 11.6% |
| Mexican American Indians | 7.8 /100 | #213 | Tragic 11.6% |
| Lithuanians | 6.6 /100 | #214 | Tragic 11.6% |
| Indonesians | 5.9 /100 | #215 | Tragic 11.6% |
| Immigrants | Dominican Republic | 4.9 /100 | #216 | Tragic 11.7% |
| Immigrants | Dominica | 4.6 /100 | #217 | Tragic 11.7% |