Immigrants from Hungary vs Maltese Disability

COMPARE

Immigrants from Hungary
Race
Ancestry
AfghanAfricanAlaska NativeAlaskan AthabascanAlbanianAleutAlsatianAmericanApacheArabArapahoArgentineanArmenianAssyrian/Chaldean/SyriacAustralianAustrianBahamianBangladeshiBarbadianBasqueBelgianBelizeanBermudanBhutaneseBlackfeetBolivianBrazilianBritishBritish West IndianBulgarianBurmeseCajunCambodianCanadianCape VerdeanCarpatho RusynCelticCentral AmericanCentral American IndianCherokeeCheyenneChickasawChileanChineseChippewaChoctawColombianColvilleComancheCosta RicanCreeCreekCroatianCrowCubanCypriotCzechCzechoslovakianDanishDelawareDominicanDutchDutch West IndianEastern EuropeanEcuadorianEgyptianEnglishEstonianEthiopianEuropeanFijianFilipinoFinnishFrenchFrench American IndianFrench CanadianGermanGerman RussianGhanaianGreekGuamanian/ChamorroGuatemalanGuyaneseHaitianHmongHonduranHopiHoumaHungarianIcelanderIndian (Asian)IndonesianInupiatIranianIraqiIrishIroquoisIsraeliItalianJamaicanJapaneseJordanianKenyanKiowaKoreanLaotianLatvianLebaneseLiberianLithuanianLumbeeLuxembourgerMacedonianMalaysianMarshalleseMenomineeMexicanMexican American IndianMongolianMoroccanNative HawaiianNavajoNepaleseNew ZealanderNicaraguanNigerianNorthern EuropeanNorwegianOkinawanOsageOttawaPaiutePakistaniPalestinianPanamanianParaguayanPennsylvania GermanPeruvianPimaPolishPortuguesePotawatomiPuebloPuerto RicanPuget Sound SalishRomanianRussianSalvadoranSamoanScandinavianScotch-IrishScottishSeminoleSenegaleseSerbianShoshoneSierra LeoneanSiouxSlavicSlovakSloveneSomaliSouth AfricanSouth AmericanSouth American IndianSoviet UnionSpaniardSpanishSpanish AmericanSpanish American IndianSri LankanSubsaharan AfricanSudaneseSwedishSwissSyrianTaiwaneseThaiTlingit-HaidaTohono O'OdhamTonganTrinidadian and TobagonianTsimshianTurkishU.S. Virgin IslanderUgandanUkrainianUruguayanUteVenezuelanVietnameseWelshWest IndianYakamaYaquiYugoslavianYumanYup'ikZimbabwean
Immigration
NonimmigrantsImmigrantsAfghanistanAfricaAlbaniaArgentinaArmeniaAsiaAustraliaAustriaBahamasBangladeshBarbadosBelarusBelgiumBelizeBoliviaBosnia and HerzegovinaBrazilBulgariaBurma/MyanmarCabo VerdeCambodiaCameroonCanadaCaribbeanCentral AmericaChileChinaColombiaCongoCosta RicaCroatiaCubaCzechoslovakiaDenmarkDominicaDominican RepublicEastern AfricaEastern AsiaEastern EuropeEcuadorEgyptEl SalvadorEnglandEritreaEthiopiaEuropeFijiFranceGermanyGhanaGreeceGrenadaGuatemalaGuyanaHaitiHondurasHong KongHungaryIndiaIndonesiaIranIraqIrelandIsraelItalyJamaicaJapanJordanKazakhstanKenyaKoreaKuwaitLaosLatin AmericaLatviaLebanonLiberiaLithuaniaMalaysiaMexicoMicronesiaMiddle AfricaMoldovaMoroccoNepalNetherlandsNicaraguaNigeriaNorth AmericaNorth MacedoniaNorthern AfricaNorthern EuropeNorwayOceaniaPakistanPanamaPeruPhilippinesPolandPortugalRomaniaRussiaSaudi ArabiaScotlandSenegalSerbiaSierra LeoneSingaporeSomaliaSouth AfricaSouth AmericaSouth Central AsiaSouth Eastern AsiaSouthern EuropeSpainSri LankaSt. Vincent and the GrenadinesSudanSwedenSwitzerlandSyriaTaiwanThailandTrinidad and TobagoTurkeyUgandaUkraineUruguayUzbekistanVenezuelaVietnamWest IndiesWestern AfricaWestern AsiaWestern EuropeYemenZaireZimbabweAzores
Maltese
Race
Ancestry
AfghanAfricanAlaska NativeAlaskan AthabascanAlbanianAleutAlsatianAmericanApacheArabArapahoArgentineanArmenianAssyrian/Chaldean/SyriacAustralianAustrianBahamianBangladeshiBarbadianBasqueBelgianBelizeanBermudanBhutaneseBlackfeetBolivianBrazilianBritishBritish West IndianBulgarianBurmeseCajunCambodianCanadianCape VerdeanCarpatho RusynCelticCentral AmericanCentral American IndianCherokeeCheyenneChickasawChileanChineseChippewaChoctawColombianColvilleComancheCosta RicanCreeCreekCroatianCrowCubanCypriotCzechCzechoslovakianDanishDelawareDominicanDutchDutch West IndianEastern EuropeanEcuadorianEgyptianEnglishEstonianEthiopianEuropeanFijianFilipinoFinnishFrenchFrench American IndianFrench CanadianGermanGerman RussianGhanaianGreekGuamanian/ChamorroGuatemalanGuyaneseHaitianHmongHonduranHopiHoumaHungarianIcelanderIndian (Asian)IndonesianInupiatIranianIraqiIrishIroquoisIsraeliItalianJamaicanJapaneseJordanianKenyanKiowaKoreanLaotianLatvianLebaneseLiberianLithuanianLumbeeLuxembourgerMacedonianMalaysianMalteseMarshalleseMenomineeMexicanMexican American IndianMongolianMoroccanNative HawaiianNavajoNepaleseNew ZealanderNicaraguanNigerianNorthern EuropeanNorwegianOkinawanOsageOttawaPaiutePakistaniPalestinianPanamanianParaguayanPennsylvania GermanPeruvianPimaPolishPortuguesePotawatomiPuebloPuerto RicanPuget Sound SalishRomanianRussianSalvadoranSamoanScandinavianScotch-IrishScottishSeminoleSenegaleseSerbianShoshoneSierra LeoneanSiouxSlavicSlovakSloveneSomaliSouth AfricanSouth AmericanSouth American IndianSoviet UnionSpaniardSpanishSpanish AmericanSpanish American IndianSri LankanSubsaharan AfricanSudaneseSwedishSwissSyrianTaiwaneseThaiTlingit-HaidaTohono O'OdhamTonganTrinidadian and TobagonianTsimshianTurkishU.S. Virgin IslanderUgandanUkrainianUruguayanUteVenezuelanVietnameseWelshWest IndianYakamaYaquiYugoslavianYumanYup'ikZimbabwean
Immigration
NonimmigrantsImmigrantsAfghanistanAfricaAlbaniaArgentinaArmeniaAsiaAustraliaAustriaBahamasBangladeshBarbadosBelarusBelgiumBelizeBoliviaBosnia and HerzegovinaBrazilBulgariaBurma/MyanmarCabo VerdeCambodiaCameroonCanadaCaribbeanCentral AmericaChileChinaColombiaCongoCosta RicaCroatiaCubaCzechoslovakiaDenmarkDominicaDominican RepublicEastern AfricaEastern AsiaEastern EuropeEcuadorEgyptEl SalvadorEnglandEritreaEthiopiaEuropeFijiFranceGermanyGhanaGreeceGrenadaGuatemalaGuyanaHaitiHondurasHong KongIndiaIndonesiaIranIraqIrelandIsraelItalyJamaicaJapanJordanKazakhstanKenyaKoreaKuwaitLaosLatin AmericaLatviaLebanonLiberiaLithuaniaMalaysiaMexicoMicronesiaMiddle AfricaMoldovaMoroccoNepalNetherlandsNicaraguaNigeriaNorth AmericaNorth MacedoniaNorthern AfricaNorthern EuropeNorwayOceaniaPakistanPanamaPeruPhilippinesPolandPortugalRomaniaRussiaSaudi ArabiaScotlandSenegalSerbiaSierra LeoneSingaporeSomaliaSouth AfricaSouth AmericaSouth Central AsiaSouth Eastern AsiaSouthern EuropeSpainSri LankaSt. Vincent and the GrenadinesSudanSwedenSwitzerlandSyriaTaiwanThailandTrinidad and TobagoTurkeyUgandaUkraineUruguayUzbekistanVenezuelaVietnamWest IndiesWestern AfricaWestern AsiaWestern EuropeYemenZaireZimbabweAzores
Disability
Income
Poverty
Unemployment
Labor Participation
Family Structure
Vehicle Availability
Education Level
Disability

Disability Comparison

Immigrants from Hungary

Maltese

Good
Average
11.5%
DISABILITY
79.0/ 100
METRIC RATING
146th/ 347
METRIC RANK
11.7%
DISABILITY
50.6/ 100
METRIC RATING
173rd/ 347
METRIC RANK

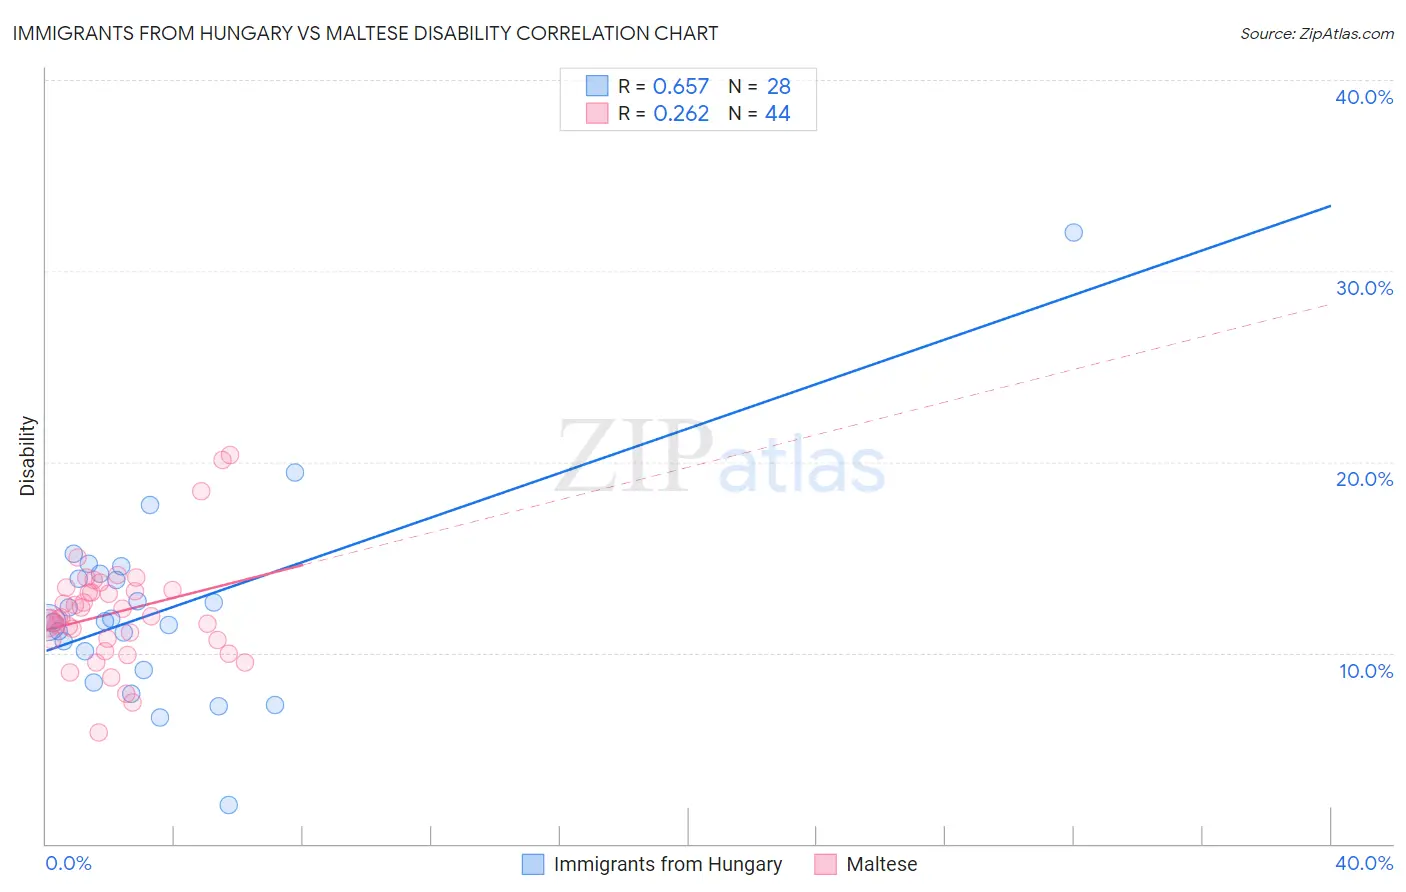
Immigrants from Hungary vs Maltese Disability Correlation Chart

The statistical analysis conducted on geographies consisting of 195,708,395 people shows a significant positive correlation between the proportion of Immigrants from Hungary and percentage of population with a disability in the United States with a correlation coefficient (R) of 0.657 and weighted average of 11.5%. Similarly, the statistical analysis conducted on geographies consisting of 126,476,999 people shows a weak positive correlation between the proportion of Maltese and percentage of population with a disability in the United States with a correlation coefficient (R) of 0.262 and weighted average of 11.7%, a difference of 1.5%.
Immigrants from Hungary vs Maltese Disability

Disability Correlation Summary

MeasurementImmigrants from HungaryMaltese
Minimum2.0%5.8%
Maximum32.0%20.3%
Range30.0%14.5%
Mean12.2%12.1%
Median11.6%11.8%
Interquartile 25% (IQ1)9.6%10.7%
Interquartile 75% (IQ3)14.0%13.3%
Interquartile Range (IQR)4.4%2.6%
Standard Deviation (Sample)5.2%2.8%
Standard Deviation (Population)5.1%2.8%

Similar Demographics by Disability

Demographics Similar to Immigrants from Hungary by Disability

In terms of disability, the demographic groups most similar to Immigrants from Hungary are Immigrants from Ukraine (11.5%, a difference of 0.090%), Sudanese (11.5%, a difference of 0.12%), Nigerian (11.5%, a difference of 0.16%), Australian (11.5%, a difference of 0.25%), and Moroccan (11.5%, a difference of 0.32%).
DemographicsRating | RankDisability
Ghanaians
87.0
/100
|
#139
Excellent
11.5%
Russians
86.8
/100
|
#140
Excellent
11.5%
Immigrants | Grenada
86.1
/100
|
#141
Excellent
11.5%
Immigrants | Sudan
85.3
/100
|
#142
Excellent
11.5%
Moroccans
83.3
/100
|
#143
Excellent
11.5%
Australians
82.5
/100
|
#144
Excellent
11.5%
Nigerians
81.3
/100
|
#145
Excellent
11.5%
Immigrants | Hungary
79.0
/100
|
#146
Good
11.5%
Immigrants | Ukraine
77.6
/100
|
#147
Good
11.5%
Sudanese
77.1
/100
|
#148
Good
11.5%
Immigrants | Norway
73.2
/100
|
#149
Good
11.6%
Romanians
72.7
/100
|
#150
Good
11.6%
Immigrants | Kenya
72.1
/100
|
#151
Good
11.6%
Immigrants | Moldova
72.0
/100
|
#152
Good
11.6%
Immigrants | Ghana
71.2
/100
|
#153
Good
11.6%

Demographics Similar to Maltese by Disability

In terms of disability, the demographic groups most similar to Maltese are Albanian (11.7%, a difference of 0.030%), Trinidadian and Tobagonian (11.7%, a difference of 0.090%), Haitian (11.7%, a difference of 0.090%), Immigrants from Albania (11.7%, a difference of 0.10%), and Immigrants from Southern Europe (11.7%, a difference of 0.10%).
DemographicsRating | RankDisability
Pakistanis
54.7
/100
|
#166
Average
11.7%
Estonians
54.4
/100
|
#167
Average
11.7%
Immigrants | Latin America
54.1
/100
|
#168
Average
11.7%
Immigrants | Austria
53.4
/100
|
#169
Average
11.7%
Immigrants | Albania
52.8
/100
|
#170
Average
11.7%
Immigrants | Southern Europe
52.8
/100
|
#171
Average
11.7%
Trinidadians and Tobagonians
52.7
/100
|
#172
Average
11.7%
Maltese
50.6
/100
|
#173
Average
11.7%
Albanians
50.0
/100
|
#174
Average
11.7%
Haitians
48.6
/100
|
#175
Average
11.7%
Immigrants | Western Africa
47.5
/100
|
#176
Average
11.7%
Immigrants | Central America
46.6
/100
|
#177
Average
11.7%
Greeks
46.2
/100
|
#178
Average
11.7%
Immigrants | Armenia
41.9
/100
|
#179
Average
11.7%
Immigrants | Honduras
37.8
/100
|
#180
Fair
11.8%