Immigrants from Hong Kong vs Lebanese Ambulatory Disability
COMPARE
Immigrants from Hong Kong
Lebanese
Ambulatory Disability
Ambulatory Disability Comparison
Immigrants from Hong Kong
Lebanese
5.3%
AMBULATORY DISABILITY
100.0/ 100
METRIC RATING
16th/ 347
METRIC RANK
6.1%
AMBULATORY DISABILITY
66.2/ 100
METRIC RATING
163rd/ 347
METRIC RANK
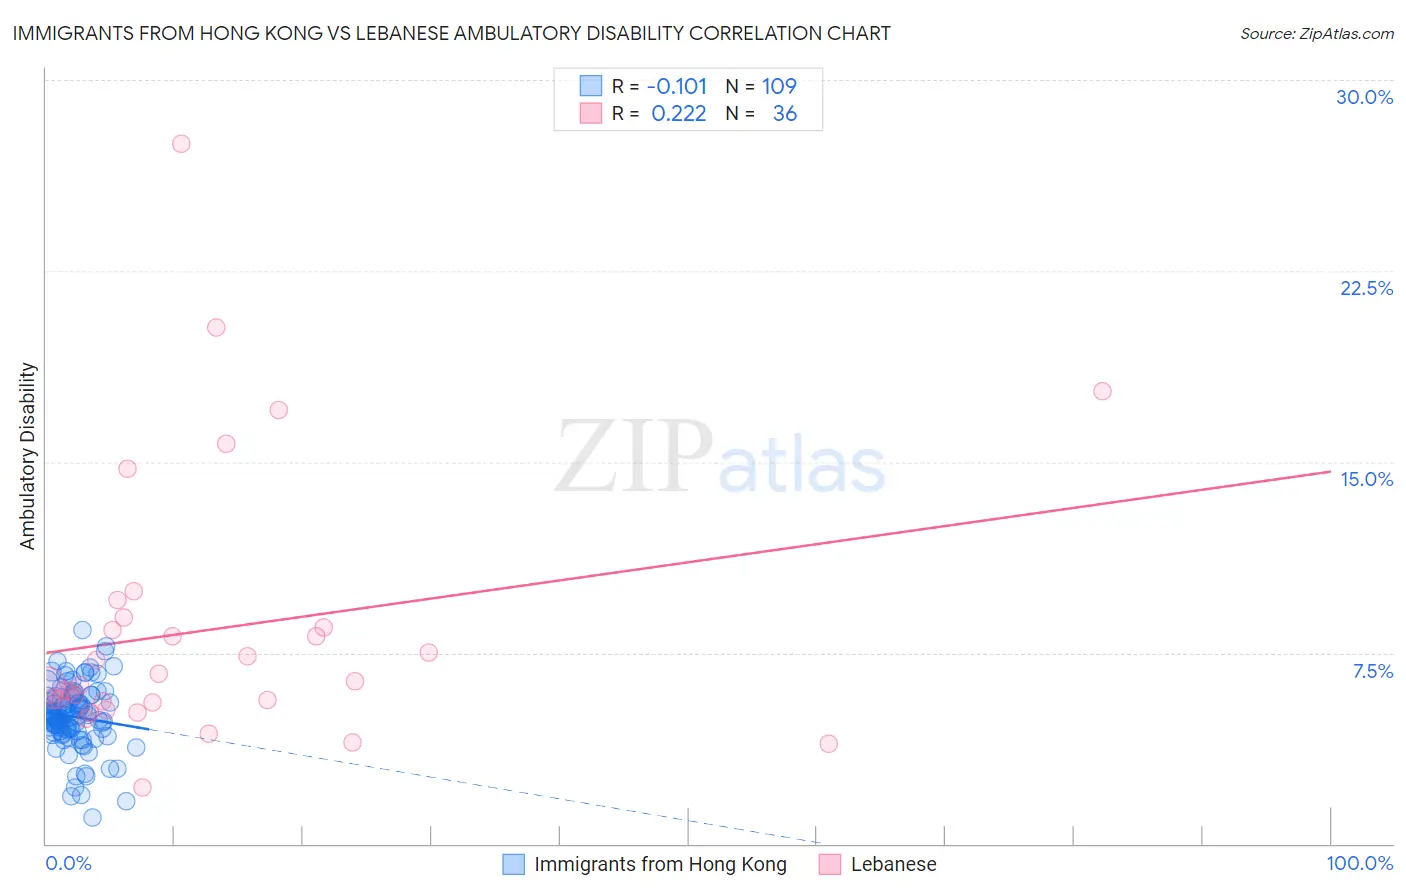
Immigrants from Hong Kong vs Lebanese Ambulatory Disability Correlation Chart
The statistical analysis conducted on geographies consisting of 253,955,040 people shows a poor negative correlation between the proportion of Immigrants from Hong Kong and percentage of population with ambulatory disability in the United States with a correlation coefficient (R) of -0.101 and weighted average of 5.3%. Similarly, the statistical analysis conducted on geographies consisting of 401,495,735 people shows a weak positive correlation between the proportion of Lebanese and percentage of population with ambulatory disability in the United States with a correlation coefficient (R) of 0.222 and weighted average of 6.1%, a difference of 13.6%.
Ambulatory Disability Correlation Summary
| Measurement | Immigrants from Hong Kong | Lebanese |
| Minimum | 1.0% | 2.2% |
| Maximum | 8.4% | 27.5% |
| Range | 7.4% | 25.3% |
| Mean | 5.0% | 8.4% |
| Median | 5.0% | 6.3% |
| Interquartile 25% (IQ1) | 4.4% | 5.6% |
| Interquartile 75% (IQ3) | 5.8% | 8.7% |
| Interquartile Range (IQR) | 1.3% | 3.1% |
| Standard Deviation (Sample) | 1.3% | 5.3% |
| Standard Deviation (Population) | 1.3% | 5.2% |
Similar Demographics by Ambulatory Disability
Demographics Similar to Immigrants from Hong Kong by Ambulatory Disability
In terms of ambulatory disability, the demographic groups most similar to Immigrants from Hong Kong are Immigrants from Ethiopia (5.4%, a difference of 0.34%), Immigrants from Sri Lanka (5.4%, a difference of 0.34%), Indian (Asian) (5.4%, a difference of 0.45%), Ethiopian (5.4%, a difference of 0.47%), and Immigrants from Kuwait (5.4%, a difference of 0.47%).
| Demographics | Rating | Rank | Ambulatory Disability |
| Iranians | 100.0 /100 | #9 | Exceptional 5.1% |
| Yup'ik | 100.0 /100 | #10 | Exceptional 5.2% |
| Immigrants | Korea | 100.0 /100 | #11 | Exceptional 5.2% |
| Okinawans | 100.0 /100 | #12 | Exceptional 5.3% |
| Burmese | 100.0 /100 | #13 | Exceptional 5.3% |
| Immigrants | Eastern Asia | 100.0 /100 | #14 | Exceptional 5.3% |
| Immigrants | China | 100.0 /100 | #15 | Exceptional 5.3% |
| Immigrants | Hong Kong | 100.0 /100 | #16 | Exceptional 5.3% |
| Immigrants | Ethiopia | 100.0 /100 | #17 | Exceptional 5.4% |
| Immigrants | Sri Lanka | 100.0 /100 | #18 | Exceptional 5.4% |
| Indians (Asian) | 100.0 /100 | #19 | Exceptional 5.4% |
| Ethiopians | 100.0 /100 | #20 | Exceptional 5.4% |
| Immigrants | Kuwait | 100.0 /100 | #21 | Exceptional 5.4% |
| Immigrants | Israel | 100.0 /100 | #22 | Exceptional 5.4% |
| Tongans | 100.0 /100 | #23 | Exceptional 5.4% |
Demographics Similar to Lebanese by Ambulatory Disability
In terms of ambulatory disability, the demographic groups most similar to Lebanese are Nigerian (6.1%, a difference of 0.050%), Basque (6.1%, a difference of 0.15%), Immigrants from Belarus (6.1%, a difference of 0.18%), Nicaraguan (6.1%, a difference of 0.18%), and Iraqi (6.1%, a difference of 0.20%).
| Demographics | Rating | Rank | Ambulatory Disability |
| Northern Europeans | 71.8 /100 | #156 | Good 6.0% |
| Ghanaians | 71.3 /100 | #157 | Good 6.0% |
| Immigrants | Fiji | 71.2 /100 | #158 | Good 6.0% |
| Immigrants | Latvia | 71.1 /100 | #159 | Good 6.0% |
| Central Americans | 69.8 /100 | #160 | Good 6.0% |
| Immigrants | Belarus | 69.2 /100 | #161 | Good 6.1% |
| Nigerians | 67.1 /100 | #162 | Good 6.1% |
| Lebanese | 66.2 /100 | #163 | Good 6.1% |
| Basques | 63.7 /100 | #164 | Good 6.1% |
| Nicaraguans | 63.2 /100 | #165 | Good 6.1% |
| Iraqis | 62.8 /100 | #166 | Good 6.1% |
| Immigrants | Oceania | 60.7 /100 | #167 | Good 6.1% |
| Ecuadorians | 60.5 /100 | #168 | Good 6.1% |
| Immigrants | Southern Europe | 58.1 /100 | #169 | Average 6.1% |
| Immigrants | Ecuador | 53.8 /100 | #170 | Average 6.1% |