Immigrants from Ghana vs Lumbee Disability Age 65 to 74
COMPARE
Immigrants from Ghana
Lumbee
Disability Age 65 to 74
Disability Age 65 to 74 Comparison
Immigrants from Ghana
Lumbee
24.5%
DISABILITY AGE 65 TO 74
3.0/ 100
METRIC RATING
238th/ 347
METRIC RANK
32.7%
DISABILITY AGE 65 TO 74
0.0/ 100
METRIC RATING
340th/ 347
METRIC RANK
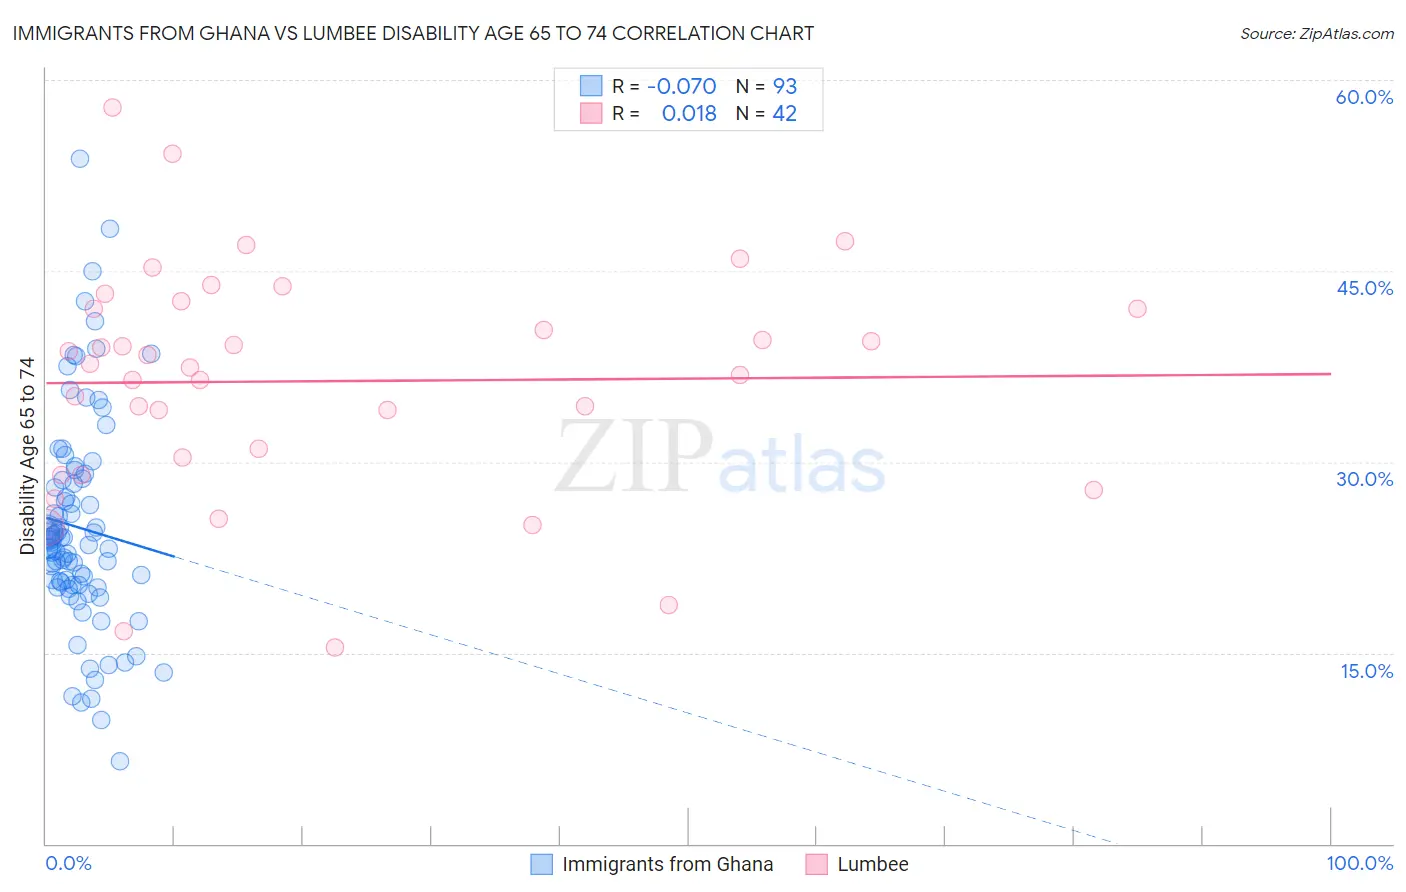
Immigrants from Ghana vs Lumbee Disability Age 65 to 74 Correlation Chart
The statistical analysis conducted on geographies consisting of 199,556,575 people shows a slight negative correlation between the proportion of Immigrants from Ghana and percentage of population with a disability between the ages 65 and 75 in the United States with a correlation coefficient (R) of -0.070 and weighted average of 24.5%. Similarly, the statistical analysis conducted on geographies consisting of 92,106,764 people shows no correlation between the proportion of Lumbee and percentage of population with a disability between the ages 65 and 75 in the United States with a correlation coefficient (R) of 0.018 and weighted average of 32.7%, a difference of 33.5%.
Disability Age 65 to 74 Correlation Summary
| Measurement | Immigrants from Ghana | Lumbee |
| Minimum | 6.5% | 15.4% |
| Maximum | 53.8% | 57.9% |
| Range | 47.4% | 42.5% |
| Mean | 24.8% | 36.3% |
| Median | 23.8% | 37.5% |
| Interquartile 25% (IQ1) | 20.3% | 30.3% |
| Interquartile 75% (IQ3) | 28.6% | 42.0% |
| Interquartile Range (IQR) | 8.3% | 11.7% |
| Standard Deviation (Sample) | 8.4% | 9.1% |
| Standard Deviation (Population) | 8.4% | 9.0% |
Similar Demographics by Disability Age 65 to 74
Demographics Similar to Immigrants from Ghana by Disability Age 65 to 74
In terms of disability age 65 to 74, the demographic groups most similar to Immigrants from Ghana are West Indian (24.5%, a difference of 0.17%), Immigrants from Caribbean (24.6%, a difference of 0.22%), German Russian (24.4%, a difference of 0.27%), Scotch-Irish (24.4%, a difference of 0.31%), and Spaniard (24.6%, a difference of 0.31%).
| Demographics | Rating | Rank | Disability Age 65 to 74 |
| Immigrants | Thailand | 5.2 /100 | #231 | Tragic 24.3% |
| Immigrants | Zaire | 5.0 /100 | #232 | Tragic 24.3% |
| Bahamians | 4.5 /100 | #233 | Tragic 24.4% |
| Panamanians | 4.2 /100 | #234 | Tragic 24.4% |
| Scotch-Irish | 3.8 /100 | #235 | Tragic 24.4% |
| German Russians | 3.7 /100 | #236 | Tragic 24.4% |
| West Indians | 3.4 /100 | #237 | Tragic 24.5% |
| Immigrants | Ghana | 3.0 /100 | #238 | Tragic 24.5% |
| Immigrants | Caribbean | 2.6 /100 | #239 | Tragic 24.6% |
| Spaniards | 2.4 /100 | #240 | Tragic 24.6% |
| Immigrants | Western Africa | 2.3 /100 | #241 | Tragic 24.6% |
| Immigrants | Senegal | 2.2 /100 | #242 | Tragic 24.6% |
| Spanish | 2.2 /100 | #243 | Tragic 24.6% |
| Armenians | 2.0 /100 | #244 | Tragic 24.7% |
| British West Indians | 2.0 /100 | #245 | Tragic 24.7% |
Demographics Similar to Lumbee by Disability Age 65 to 74
In terms of disability age 65 to 74, the demographic groups most similar to Lumbee are Kiowa (32.6%, a difference of 0.52%), Tsimshian (32.9%, a difference of 0.53%), Pueblo (33.1%, a difference of 1.1%), Alaskan Athabascan (32.4%, a difference of 1.1%), and Houma (32.3%, a difference of 1.3%).
| Demographics | Rating | Rank | Disability Age 65 to 74 |
| Colville | 0.0 /100 | #333 | Tragic 30.5% |
| Alaska Natives | 0.0 /100 | #334 | Tragic 30.6% |
| Cheyenne | 0.0 /100 | #335 | Tragic 31.1% |
| Yuman | 0.0 /100 | #336 | Tragic 31.5% |
| Houma | 0.0 /100 | #337 | Tragic 32.3% |
| Alaskan Athabascans | 0.0 /100 | #338 | Tragic 32.4% |
| Kiowa | 0.0 /100 | #339 | Tragic 32.6% |
| Lumbee | 0.0 /100 | #340 | Tragic 32.7% |
| Tsimshian | 0.0 /100 | #341 | Tragic 32.9% |
| Pueblo | 0.0 /100 | #342 | Tragic 33.1% |
| Navajo | 0.0 /100 | #343 | Tragic 33.3% |
| Inupiat | 0.0 /100 | #344 | Tragic 34.5% |
| Tohono O'odham | 0.0 /100 | #345 | Tragic 36.0% |
| Yup'ik | 0.0 /100 | #346 | Tragic 37.8% |
| Pima | 0.0 /100 | #347 | Tragic 38.6% |