Houma vs Lumbee Disability Age 65 to 74
COMPARE
Houma
Lumbee
Disability Age 65 to 74
Disability Age 65 to 74 Comparison
Houma
Lumbee
32.3%
DISABILITY AGE 65 TO 74
0.0/ 100
METRIC RATING
337th/ 347
METRIC RANK
32.7%
DISABILITY AGE 65 TO 74
0.0/ 100
METRIC RATING
340th/ 347
METRIC RANK
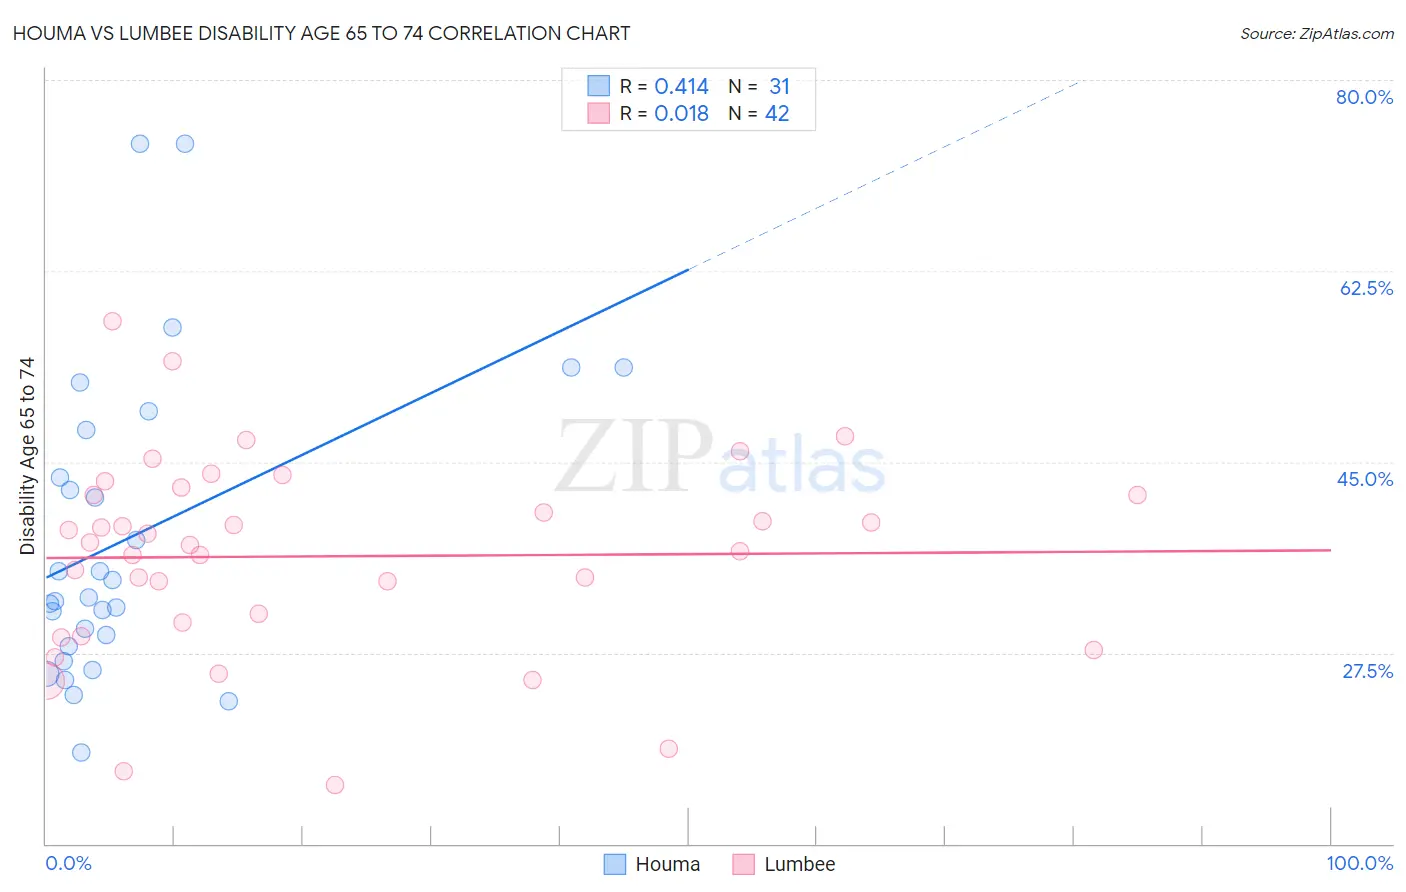
Houma vs Lumbee Disability Age 65 to 74 Correlation Chart
The statistical analysis conducted on geographies consisting of 36,769,608 people shows a moderate positive correlation between the proportion of Houma and percentage of population with a disability between the ages 65 and 75 in the United States with a correlation coefficient (R) of 0.414 and weighted average of 32.3%. Similarly, the statistical analysis conducted on geographies consisting of 92,106,764 people shows no correlation between the proportion of Lumbee and percentage of population with a disability between the ages 65 and 75 in the United States with a correlation coefficient (R) of 0.018 and weighted average of 32.7%, a difference of 1.3%.
Disability Age 65 to 74 Correlation Summary
| Measurement | Houma | Lumbee |
| Minimum | 18.4% | 15.4% |
| Maximum | 74.2% | 57.9% |
| Range | 55.8% | 42.5% |
| Mean | 38.1% | 36.3% |
| Median | 32.5% | 37.5% |
| Interquartile 25% (IQ1) | 28.1% | 30.3% |
| Interquartile 75% (IQ3) | 47.9% | 42.0% |
| Interquartile Range (IQR) | 19.8% | 11.7% |
| Standard Deviation (Sample) | 14.0% | 9.1% |
| Standard Deviation (Population) | 13.8% | 9.0% |
Demographics Similar to Houma and Lumbee by Disability Age 65 to 74
In terms of disability age 65 to 74, the demographic groups most similar to Houma are Alaskan Athabascan (32.4%, a difference of 0.19%), Kiowa (32.6%, a difference of 0.81%), Tsimshian (32.9%, a difference of 1.9%), Pueblo (33.1%, a difference of 2.5%), and Yuman (31.5%, a difference of 2.6%). Similarly, the demographic groups most similar to Lumbee are Kiowa (32.6%, a difference of 0.52%), Tsimshian (32.9%, a difference of 0.53%), Pueblo (33.1%, a difference of 1.1%), Alaskan Athabascan (32.4%, a difference of 1.1%), and Navajo (33.3%, a difference of 1.9%).
| Demographics | Rating | Rank | Disability Age 65 to 74 |
| Hopi | 0.0 /100 | #328 | Tragic 30.0% |
| Choctaw | 0.0 /100 | #329 | Tragic 30.2% |
| Creek | 0.0 /100 | #330 | Tragic 30.2% |
| Chickasaw | 0.0 /100 | #331 | Tragic 30.2% |
| Natives/Alaskans | 0.0 /100 | #332 | Tragic 30.4% |
| Colville | 0.0 /100 | #333 | Tragic 30.5% |
| Alaska Natives | 0.0 /100 | #334 | Tragic 30.6% |
| Cheyenne | 0.0 /100 | #335 | Tragic 31.1% |
| Yuman | 0.0 /100 | #336 | Tragic 31.5% |
| Houma | 0.0 /100 | #337 | Tragic 32.3% |
| Alaskan Athabascans | 0.0 /100 | #338 | Tragic 32.4% |
| Kiowa | 0.0 /100 | #339 | Tragic 32.6% |
| Lumbee | 0.0 /100 | #340 | Tragic 32.7% |
| Tsimshian | 0.0 /100 | #341 | Tragic 32.9% |
| Pueblo | 0.0 /100 | #342 | Tragic 33.1% |
| Navajo | 0.0 /100 | #343 | Tragic 33.3% |
| Inupiat | 0.0 /100 | #344 | Tragic 34.5% |
| Tohono O'odham | 0.0 /100 | #345 | Tragic 36.0% |
| Yup'ik | 0.0 /100 | #346 | Tragic 37.8% |
| Pima | 0.0 /100 | #347 | Tragic 38.6% |