Immigrants from France vs South African Ambulatory Disability
COMPARE
Immigrants from France
South African
Ambulatory Disability
Ambulatory Disability Comparison
Immigrants from France
South Africans
5.6%
AMBULATORY DISABILITY
99.7/ 100
METRIC RATING
63rd/ 347
METRIC RANK
5.9%
AMBULATORY DISABILITY
96.3/ 100
METRIC RATING
112th/ 347
METRIC RANK
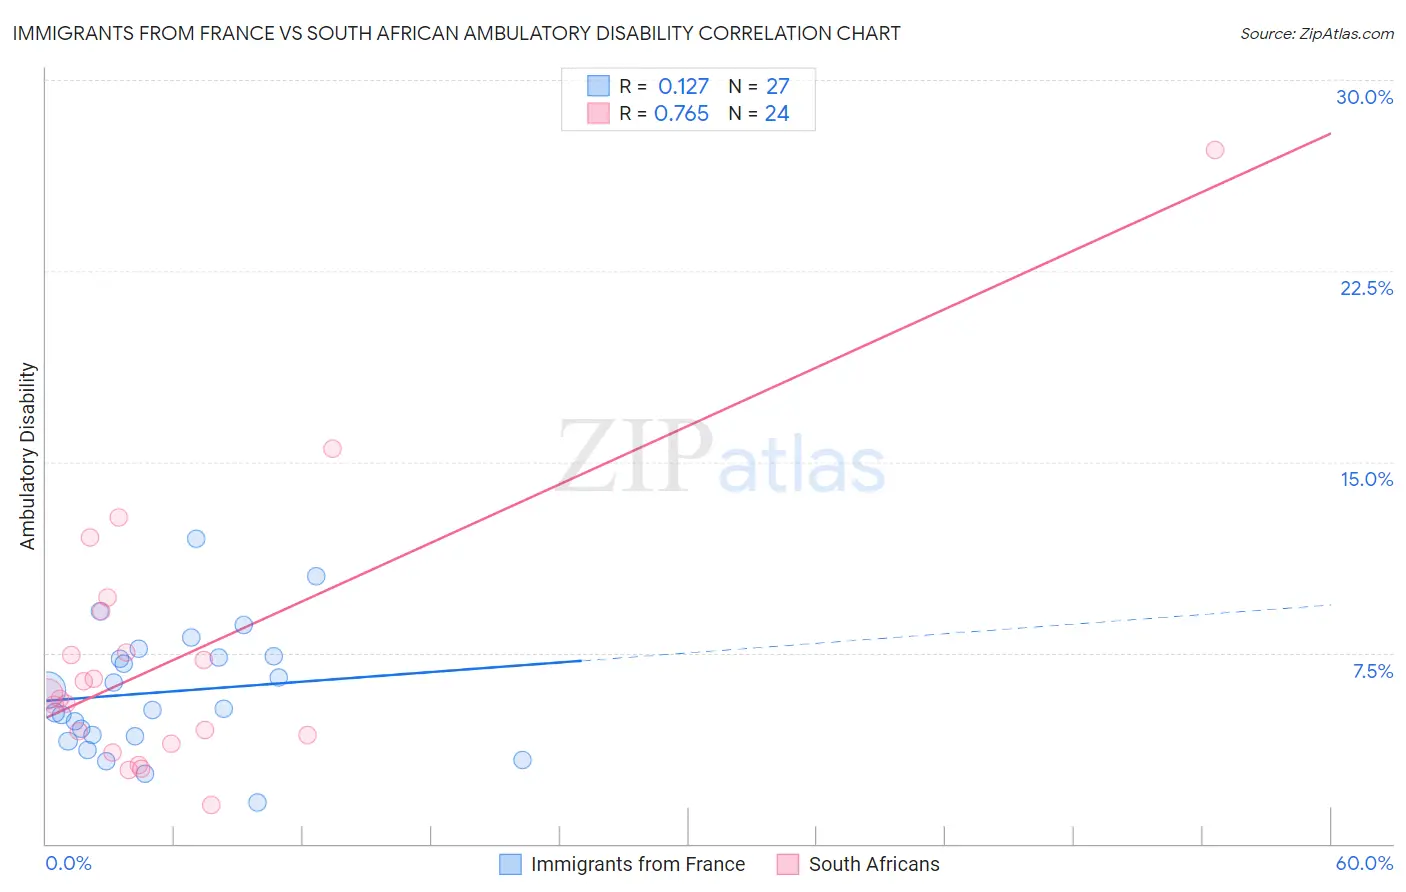
Immigrants from France vs South African Ambulatory Disability Correlation Chart
The statistical analysis conducted on geographies consisting of 287,866,791 people shows a poor positive correlation between the proportion of Immigrants from France and percentage of population with ambulatory disability in the United States with a correlation coefficient (R) of 0.127 and weighted average of 5.6%. Similarly, the statistical analysis conducted on geographies consisting of 182,561,768 people shows a strong positive correlation between the proportion of South Africans and percentage of population with ambulatory disability in the United States with a correlation coefficient (R) of 0.765 and weighted average of 5.9%, a difference of 3.7%.
Ambulatory Disability Correlation Summary
| Measurement | Immigrants from France | South African |
| Minimum | 1.6% | 1.5% |
| Maximum | 12.0% | 27.3% |
| Range | 10.4% | 25.7% |
| Mean | 6.0% | 7.3% |
| Median | 5.3% | 5.8% |
| Interquartile 25% (IQ1) | 4.2% | 4.1% |
| Interquartile 75% (IQ3) | 7.4% | 8.3% |
| Interquartile Range (IQR) | 3.2% | 4.2% |
| Standard Deviation (Sample) | 2.4% | 5.4% |
| Standard Deviation (Population) | 2.4% | 5.3% |
Similar Demographics by Ambulatory Disability
Demographics Similar to Immigrants from France by Ambulatory Disability
In terms of ambulatory disability, the demographic groups most similar to Immigrants from France are Immigrants from Spain (5.6%, a difference of 0.12%), Immigrants from Belgium (5.6%, a difference of 0.13%), Laotian (5.7%, a difference of 0.13%), Immigrants from Switzerland (5.7%, a difference of 0.16%), and Israeli (5.7%, a difference of 0.25%).
| Demographics | Rating | Rank | Ambulatory Disability |
| Inupiat | 99.8 /100 | #56 | Exceptional 5.6% |
| Immigrants | Brazil | 99.8 /100 | #57 | Exceptional 5.6% |
| Immigrants | Zimbabwe | 99.8 /100 | #58 | Exceptional 5.6% |
| Immigrants | Afghanistan | 99.8 /100 | #59 | Exceptional 5.6% |
| Immigrants | Lithuania | 99.8 /100 | #60 | Exceptional 5.6% |
| Immigrants | Belgium | 99.7 /100 | #61 | Exceptional 5.6% |
| Immigrants | Spain | 99.7 /100 | #62 | Exceptional 5.6% |
| Immigrants | France | 99.7 /100 | #63 | Exceptional 5.6% |
| Laotians | 99.7 /100 | #64 | Exceptional 5.7% |
| Immigrants | Switzerland | 99.7 /100 | #65 | Exceptional 5.7% |
| Israelis | 99.6 /100 | #66 | Exceptional 5.7% |
| Immigrants | Uganda | 99.6 /100 | #67 | Exceptional 5.7% |
| Sri Lankans | 99.6 /100 | #68 | Exceptional 5.7% |
| Peruvians | 99.5 /100 | #69 | Exceptional 5.7% |
| Sierra Leoneans | 99.4 /100 | #70 | Exceptional 5.7% |
Demographics Similar to South Africans by Ambulatory Disability
In terms of ambulatory disability, the demographic groups most similar to South Africans are Danish (5.8%, a difference of 0.13%), Immigrants from Colombia (5.8%, a difference of 0.20%), Immigrants from Uruguay (5.9%, a difference of 0.22%), Immigrants from Poland (5.9%, a difference of 0.28%), and Immigrants from Netherlands (5.8%, a difference of 0.38%).
| Demographics | Rating | Rank | Ambulatory Disability |
| Immigrants | Czechoslovakia | 97.4 /100 | #105 | Exceptional 5.8% |
| Immigrants | Morocco | 97.3 /100 | #106 | Exceptional 5.8% |
| Uruguayans | 97.2 /100 | #107 | Exceptional 5.8% |
| Colombians | 97.2 /100 | #108 | Exceptional 5.8% |
| Immigrants | Netherlands | 97.1 /100 | #109 | Exceptional 5.8% |
| Immigrants | Colombia | 96.7 /100 | #110 | Exceptional 5.8% |
| Danes | 96.6 /100 | #111 | Exceptional 5.8% |
| South Africans | 96.3 /100 | #112 | Exceptional 5.9% |
| Immigrants | Uruguay | 95.6 /100 | #113 | Exceptional 5.9% |
| Immigrants | Poland | 95.4 /100 | #114 | Exceptional 5.9% |
| South American Indians | 94.8 /100 | #115 | Exceptional 5.9% |
| Immigrants | Africa | 94.7 /100 | #116 | Exceptional 5.9% |
| Immigrants | South Eastern Asia | 93.6 /100 | #117 | Exceptional 5.9% |
| Russians | 93.4 /100 | #118 | Exceptional 5.9% |
| Norwegians | 93.1 /100 | #119 | Exceptional 5.9% |