Immigrants from France vs Armenian Ambulatory Disability
COMPARE
Immigrants from France
Armenian
Ambulatory Disability
Ambulatory Disability Comparison
Immigrants from France
Armenians
5.6%
AMBULATORY DISABILITY
99.7/ 100
METRIC RATING
63rd/ 347
METRIC RANK
6.5%
AMBULATORY DISABILITY
1.5/ 100
METRIC RATING
246th/ 347
METRIC RANK
Immigrants from France vs Armenian Ambulatory Disability Correlation Chart
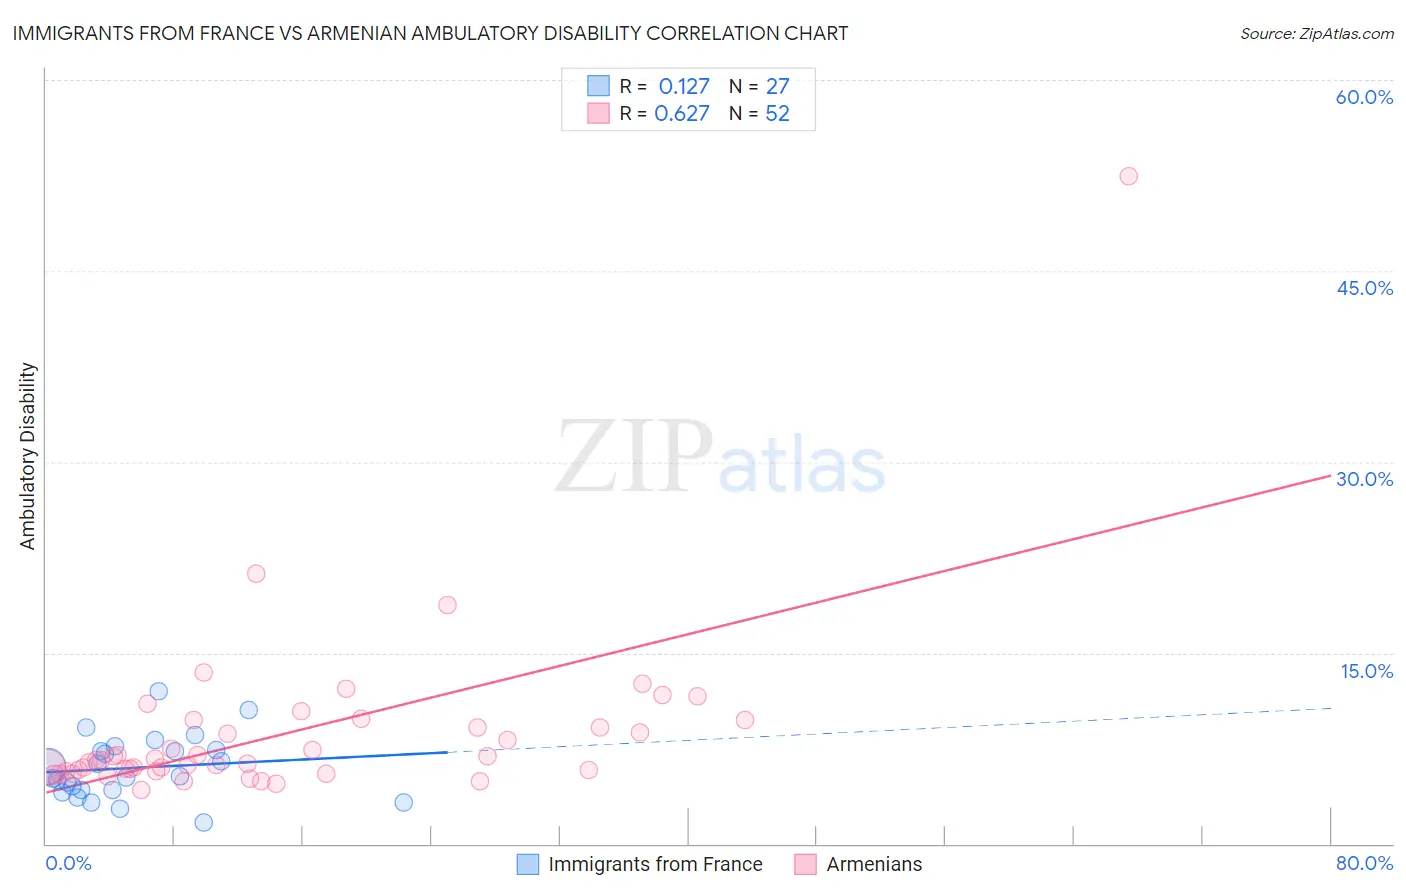
The statistical analysis conducted on geographies consisting of 287,866,791 people shows a poor positive correlation between the proportion of Immigrants from France and percentage of population with ambulatory disability in the United States with a correlation coefficient (R) of 0.127 and weighted average of 5.6%. Similarly, the statistical analysis conducted on geographies consisting of 310,863,857 people shows a significant positive correlation between the proportion of Armenians and percentage of population with ambulatory disability in the United States with a correlation coefficient (R) of 0.627 and weighted average of 6.5%, a difference of 14.4%.
Ambulatory Disability Correlation Summary
| Measurement | Immigrants from France | Armenian |
| Minimum | 1.6% | 4.2% |
| Maximum | 12.0% | 52.5% |
| Range | 10.4% | 48.3% |
| Mean | 6.0% | 8.7% |
| Median | 5.3% | 6.6% |
| Interquartile 25% (IQ1) | 4.2% | 5.7% |
| Interquartile 75% (IQ3) | 7.4% | 9.4% |
| Interquartile Range (IQR) | 3.2% | 3.7% |
| Standard Deviation (Sample) | 2.4% | 7.0% |
| Standard Deviation (Population) | 2.4% | 7.0% |
Similar Demographics by Ambulatory Disability
Demographics Similar to Immigrants from France by Ambulatory Disability
In terms of ambulatory disability, the demographic groups most similar to Immigrants from France are Immigrants from Spain (5.6%, a difference of 0.12%), Immigrants from Belgium (5.6%, a difference of 0.13%), Laotian (5.7%, a difference of 0.13%), Immigrants from Switzerland (5.7%, a difference of 0.16%), and Israeli (5.7%, a difference of 0.25%).
| Demographics | Rating | Rank | Ambulatory Disability |
| Inupiat | 99.8 /100 | #56 | Exceptional 5.6% |
| Immigrants | Brazil | 99.8 /100 | #57 | Exceptional 5.6% |
| Immigrants | Zimbabwe | 99.8 /100 | #58 | Exceptional 5.6% |
| Immigrants | Afghanistan | 99.8 /100 | #59 | Exceptional 5.6% |
| Immigrants | Lithuania | 99.8 /100 | #60 | Exceptional 5.6% |
| Immigrants | Belgium | 99.7 /100 | #61 | Exceptional 5.6% |
| Immigrants | Spain | 99.7 /100 | #62 | Exceptional 5.6% |
| Immigrants | France | 99.7 /100 | #63 | Exceptional 5.6% |
| Laotians | 99.7 /100 | #64 | Exceptional 5.7% |
| Immigrants | Switzerland | 99.7 /100 | #65 | Exceptional 5.7% |
| Israelis | 99.6 /100 | #66 | Exceptional 5.7% |
| Immigrants | Uganda | 99.6 /100 | #67 | Exceptional 5.7% |
| Sri Lankans | 99.6 /100 | #68 | Exceptional 5.7% |
| Peruvians | 99.5 /100 | #69 | Exceptional 5.7% |
| Sierra Leoneans | 99.4 /100 | #70 | Exceptional 5.7% |
Demographics Similar to Armenians by Ambulatory Disability
In terms of ambulatory disability, the demographic groups most similar to Armenians are Tlingit-Haida (6.5%, a difference of 0.020%), German (6.5%, a difference of 0.050%), Immigrants from Panama (6.5%, a difference of 0.050%), Immigrants from Cuba (6.5%, a difference of 0.050%), and Spaniard (6.5%, a difference of 0.070%).
| Demographics | Rating | Rank | Ambulatory Disability |
| Senegalese | 1.7 /100 | #239 | Tragic 6.4% |
| Immigrants | Senegal | 1.7 /100 | #240 | Tragic 6.4% |
| Immigrants | Haiti | 1.6 /100 | #241 | Tragic 6.5% |
| Spaniards | 1.6 /100 | #242 | Tragic 6.5% |
| Germans | 1.5 /100 | #243 | Tragic 6.5% |
| Immigrants | Panama | 1.5 /100 | #244 | Tragic 6.5% |
| Tlingit-Haida | 1.5 /100 | #245 | Tragic 6.5% |
| Armenians | 1.5 /100 | #246 | Tragic 6.5% |
| Immigrants | Cuba | 1.4 /100 | #247 | Tragic 6.5% |
| Immigrants | Portugal | 1.4 /100 | #248 | Tragic 6.5% |
| Native Hawaiians | 1.1 /100 | #249 | Tragic 6.5% |
| Chinese | 1.0 /100 | #250 | Tragic 6.5% |
| Hawaiians | 0.9 /100 | #251 | Tragic 6.5% |
| Immigrants | Bahamas | 0.8 /100 | #252 | Tragic 6.5% |
| Scottish | 0.7 /100 | #253 | Tragic 6.5% |