Immigrants from England vs Immigrants from Portugal Disability Age 5 to 17
COMPARE
Immigrants from England
Immigrants from Portugal
Disability Age 5 to 17
Disability Age 5 to 17 Comparison
Immigrants from England
Immigrants from Portugal
5.6%
DISABILITY AGE 5 TO 17
36.4/ 100
METRIC RATING
181st/ 347
METRIC RANK
6.4%
DISABILITY AGE 5 TO 17
0.0/ 100
METRIC RATING
315th/ 347
METRIC RANK
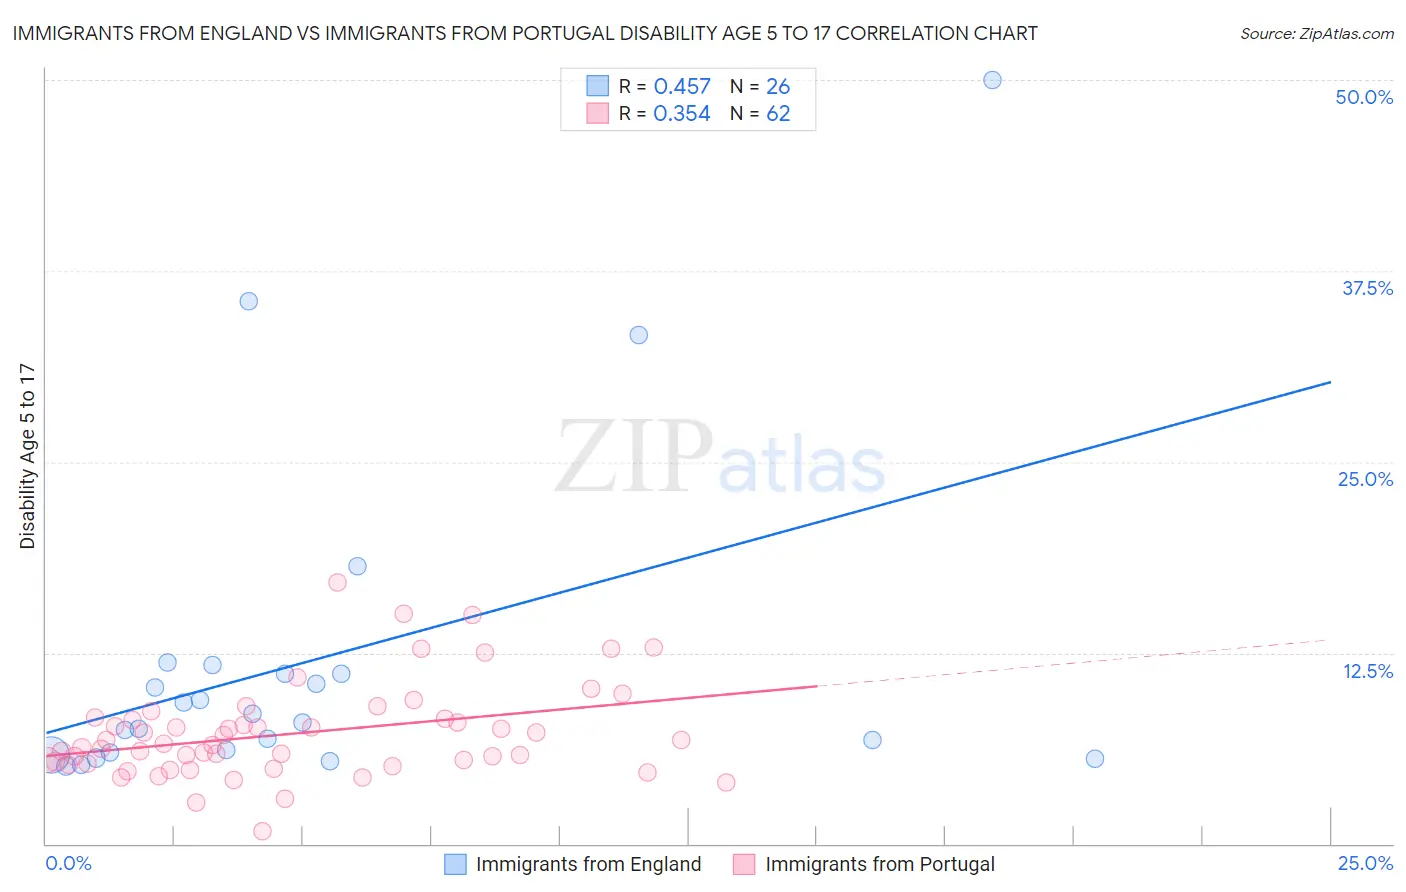
Immigrants from England vs Immigrants from Portugal Disability Age 5 to 17 Correlation Chart
The statistical analysis conducted on geographies consisting of 388,045,043 people shows a moderate positive correlation between the proportion of Immigrants from England and percentage of population with a disability between the ages 5 and 17 in the United States with a correlation coefficient (R) of 0.457 and weighted average of 5.6%. Similarly, the statistical analysis conducted on geographies consisting of 173,811,905 people shows a mild positive correlation between the proportion of Immigrants from Portugal and percentage of population with a disability between the ages 5 and 17 in the United States with a correlation coefficient (R) of 0.354 and weighted average of 6.4%, a difference of 13.9%.
Disability Age 5 to 17 Correlation Summary
| Measurement | Immigrants from England | Immigrants from Portugal |
| Minimum | 5.1% | 0.84% |
| Maximum | 50.0% | 17.1% |
| Range | 44.9% | 16.3% |
| Mean | 12.0% | 7.2% |
| Median | 8.2% | 6.5% |
| Interquartile 25% (IQ1) | 6.0% | 5.3% |
| Interquartile 75% (IQ3) | 11.1% | 8.2% |
| Interquartile Range (IQR) | 5.2% | 2.9% |
| Standard Deviation (Sample) | 10.9% | 3.1% |
| Standard Deviation (Population) | 10.7% | 3.1% |
Similar Demographics by Disability Age 5 to 17
Demographics Similar to Immigrants from England by Disability Age 5 to 17
In terms of disability age 5 to 17, the demographic groups most similar to Immigrants from England are Mexican American Indian (5.6%, a difference of 0.060%), Immigrants from Uruguay (5.6%, a difference of 0.070%), Immigrants from Latin America (5.6%, a difference of 0.11%), Syrian (5.6%, a difference of 0.14%), and Immigrants from Mexico (5.6%, a difference of 0.14%).
| Demographics | Rating | Rank | Disability Age 5 to 17 |
| Costa Ricans | 50.0 /100 | #174 | Average 5.6% |
| Shoshone | 49.4 /100 | #175 | Average 5.6% |
| Immigrants | Central America | 49.4 /100 | #176 | Average 5.6% |
| Immigrants | Western Europe | 47.8 /100 | #177 | Average 5.6% |
| Immigrants | Trinidad and Tobago | 47.6 /100 | #178 | Average 5.6% |
| Immigrants | Barbados | 40.5 /100 | #179 | Average 5.6% |
| Immigrants | Uruguay | 37.7 /100 | #180 | Fair 5.6% |
| Immigrants | England | 36.4 /100 | #181 | Fair 5.6% |
| Mexican American Indians | 35.2 /100 | #182 | Fair 5.6% |
| Immigrants | Latin America | 34.3 /100 | #183 | Fair 5.6% |
| Syrians | 33.8 /100 | #184 | Fair 5.6% |
| Immigrants | Mexico | 33.7 /100 | #185 | Fair 5.6% |
| Fijians | 31.7 /100 | #186 | Fair 5.7% |
| Immigrants | Thailand | 30.2 /100 | #187 | Fair 5.7% |
| Marshallese | 28.1 /100 | #188 | Fair 5.7% |
Demographics Similar to Immigrants from Portugal by Disability Age 5 to 17
In terms of disability age 5 to 17, the demographic groups most similar to Immigrants from Portugal are French (6.4%, a difference of 0.18%), Immigrants from Dominican Republic (6.4%, a difference of 0.18%), Kiowa (6.4%, a difference of 0.31%), Comanche (6.4%, a difference of 0.34%), and Apache (6.4%, a difference of 0.69%).
| Demographics | Rating | Rank | Disability Age 5 to 17 |
| Scotch-Irish | 0.0 /100 | #308 | Tragic 6.3% |
| Hmong | 0.0 /100 | #309 | Tragic 6.3% |
| Alaskan Athabascans | 0.0 /100 | #310 | Tragic 6.3% |
| Immigrants | Dominica | 0.0 /100 | #311 | Tragic 6.3% |
| Bermudans | 0.0 /100 | #312 | Tragic 6.4% |
| Apache | 0.0 /100 | #313 | Tragic 6.4% |
| French | 0.0 /100 | #314 | Tragic 6.4% |
| Immigrants | Portugal | 0.0 /100 | #315 | Tragic 6.4% |
| Immigrants | Dominican Republic | 0.0 /100 | #316 | Tragic 6.4% |
| Kiowa | 0.0 /100 | #317 | Tragic 6.4% |
| Comanche | 0.0 /100 | #318 | Tragic 6.4% |
| Delaware | 0.0 /100 | #319 | Tragic 6.5% |
| Africans | 0.0 /100 | #320 | Tragic 6.5% |
| Tohono O'odham | 0.0 /100 | #321 | Tragic 6.5% |
| Slovaks | 0.0 /100 | #322 | Tragic 6.5% |