Immigrants from Ecuador vs Immigrants from the Azores Hearing Disability
COMPARE
Immigrants from Ecuador
Immigrants from the Azores
Hearing Disability
Hearing Disability Comparison
Immigrants from Ecuador
Immigrants from the Azores
2.5%
HEARING DISABILITY
99.9/ 100
METRIC RATING
10th/ 347
METRIC RANK
3.7%
HEARING DISABILITY
0.0/ 100
METRIC RATING
297th/ 347
METRIC RANK
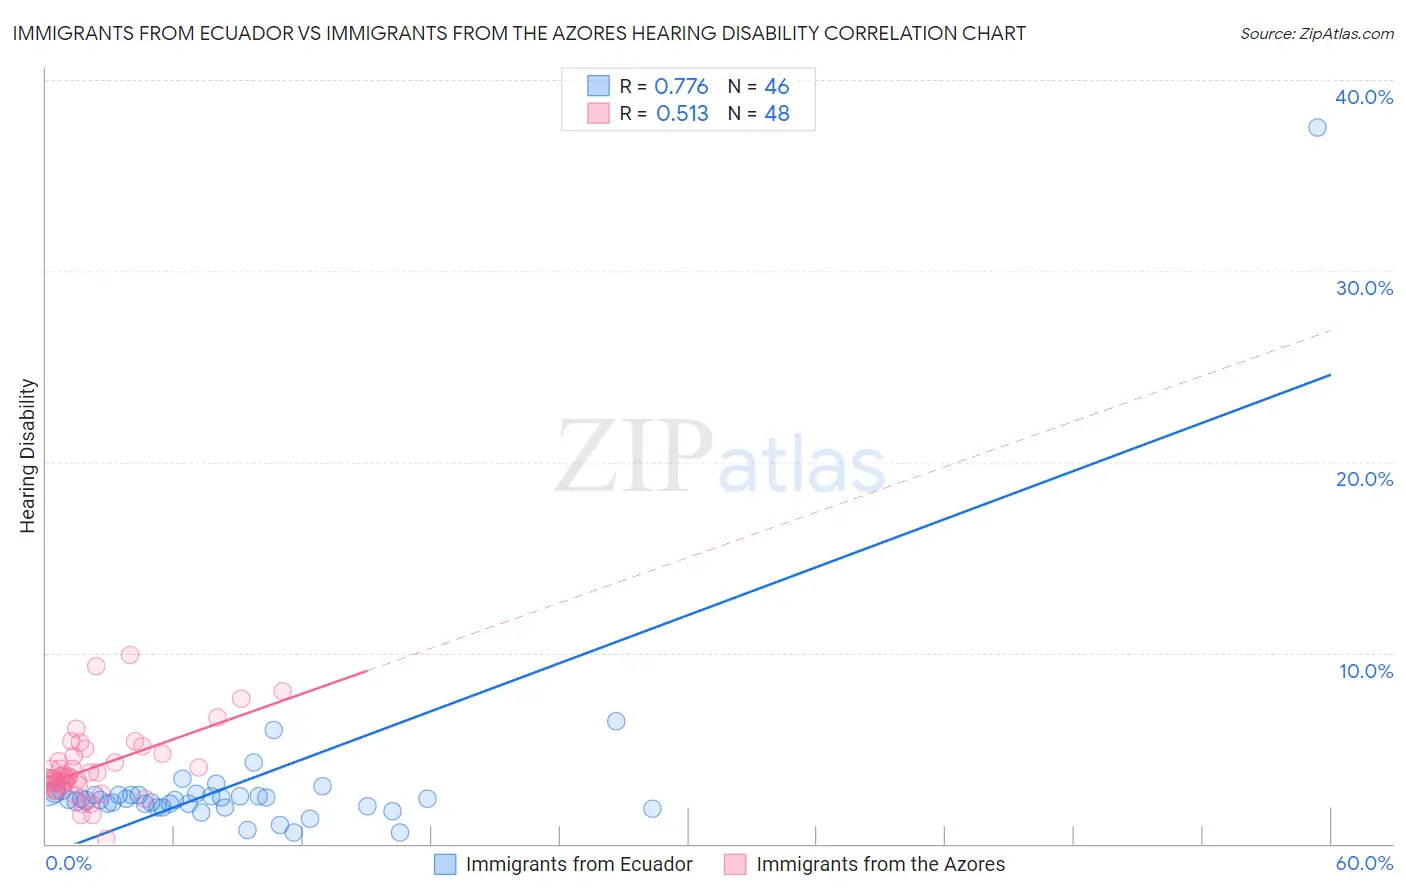
Immigrants from Ecuador vs Immigrants from the Azores Hearing Disability Correlation Chart
The statistical analysis conducted on geographies consisting of 270,917,145 people shows a strong positive correlation between the proportion of Immigrants from Ecuador and percentage of population with hearing disability in the United States with a correlation coefficient (R) of 0.776 and weighted average of 2.5%. Similarly, the statistical analysis conducted on geographies consisting of 46,255,123 people shows a substantial positive correlation between the proportion of Immigrants from the Azores and percentage of population with hearing disability in the United States with a correlation coefficient (R) of 0.513 and weighted average of 3.7%, a difference of 50.2%.
Hearing Disability Correlation Summary
| Measurement | Immigrants from Ecuador | Immigrants from the Azores |
| Minimum | 0.57% | 0.28% |
| Maximum | 37.5% | 9.9% |
| Range | 36.9% | 9.6% |
| Mean | 3.2% | 4.0% |
| Median | 2.3% | 3.5% |
| Interquartile 25% (IQ1) | 2.0% | 3.1% |
| Interquartile 75% (IQ3) | 2.6% | 4.7% |
| Interquartile Range (IQR) | 0.59% | 1.6% |
| Standard Deviation (Sample) | 5.3% | 1.9% |
| Standard Deviation (Population) | 5.2% | 1.9% |
Similar Demographics by Hearing Disability
Demographics Similar to Immigrants from Ecuador by Hearing Disability
In terms of hearing disability, the demographic groups most similar to Immigrants from Ecuador are Immigrants from Trinidad and Tobago (2.5%, a difference of 0.55%), Trinidadian and Tobagonian (2.5%, a difference of 0.86%), Immigrants from Dominican Republic (2.4%, a difference of 1.0%), Sierra Leonean (2.5%, a difference of 1.1%), and Ecuadorian (2.5%, a difference of 1.4%).
| Demographics | Rating | Rank | Hearing Disability |
| Guyanese | 100.0 /100 | #3 | Exceptional 2.3% |
| Immigrants | Guyana | 100.0 /100 | #4 | Exceptional 2.3% |
| Immigrants | Barbados | 100.0 /100 | #5 | Exceptional 2.4% |
| Vietnamese | 100.0 /100 | #6 | Exceptional 2.4% |
| Immigrants | Bangladesh | 100.0 /100 | #7 | Exceptional 2.4% |
| British West Indians | 100.0 /100 | #8 | Exceptional 2.4% |
| Immigrants | Dominican Republic | 100.0 /100 | #9 | Exceptional 2.4% |
| Immigrants | Ecuador | 99.9 /100 | #10 | Exceptional 2.5% |
| Immigrants | Trinidad and Tobago | 99.9 /100 | #11 | Exceptional 2.5% |
| Trinidadians and Tobagonians | 99.9 /100 | #12 | Exceptional 2.5% |
| Sierra Leoneans | 99.9 /100 | #13 | Exceptional 2.5% |
| Ecuadorians | 99.9 /100 | #14 | Exceptional 2.5% |
| Barbadians | 99.9 /100 | #15 | Exceptional 2.5% |
| Immigrants | West Indies | 99.9 /100 | #16 | Exceptional 2.5% |
| Immigrants | India | 99.9 /100 | #17 | Exceptional 2.5% |
Demographics Similar to Immigrants from the Azores by Hearing Disability
In terms of hearing disability, the demographic groups most similar to Immigrants from the Azores are Pima (3.7%, a difference of 0.070%), Celtic (3.7%, a difference of 0.19%), Welsh (3.7%, a difference of 0.20%), Iroquois (3.7%, a difference of 0.46%), and German (3.7%, a difference of 0.47%).
| Demographics | Rating | Rank | Hearing Disability |
| Whites/Caucasians | 0.0 /100 | #290 | Tragic 3.7% |
| Finns | 0.0 /100 | #291 | Tragic 3.7% |
| Native Hawaiians | 0.0 /100 | #292 | Tragic 3.7% |
| Norwegians | 0.0 /100 | #293 | Tragic 3.7% |
| Iroquois | 0.0 /100 | #294 | Tragic 3.7% |
| Welsh | 0.0 /100 | #295 | Tragic 3.7% |
| Pima | 0.0 /100 | #296 | Tragic 3.7% |
| Immigrants | Azores | 0.0 /100 | #297 | Tragic 3.7% |
| Celtics | 0.0 /100 | #298 | Tragic 3.7% |
| Germans | 0.0 /100 | #299 | Tragic 3.7% |
| Scottish | 0.0 /100 | #300 | Tragic 3.7% |
| Pennsylvania Germans | 0.0 /100 | #301 | Tragic 3.7% |
| Dutch | 0.0 /100 | #302 | Tragic 3.7% |
| Menominee | 0.0 /100 | #303 | Tragic 3.7% |
| French | 0.0 /100 | #304 | Tragic 3.8% |