Immigrants from Czechoslovakia vs Estonian Disability Age 65 to 74
COMPARE
Immigrants from Czechoslovakia
Estonian
Disability Age 65 to 74
Disability Age 65 to 74 Comparison
Immigrants from Czechoslovakia
Estonians
21.0%
DISABILITY AGE 65 TO 74
99.9/ 100
METRIC RATING
28th/ 347
METRIC RANK
21.4%
DISABILITY AGE 65 TO 74
99.7/ 100
METRIC RATING
44th/ 347
METRIC RANK
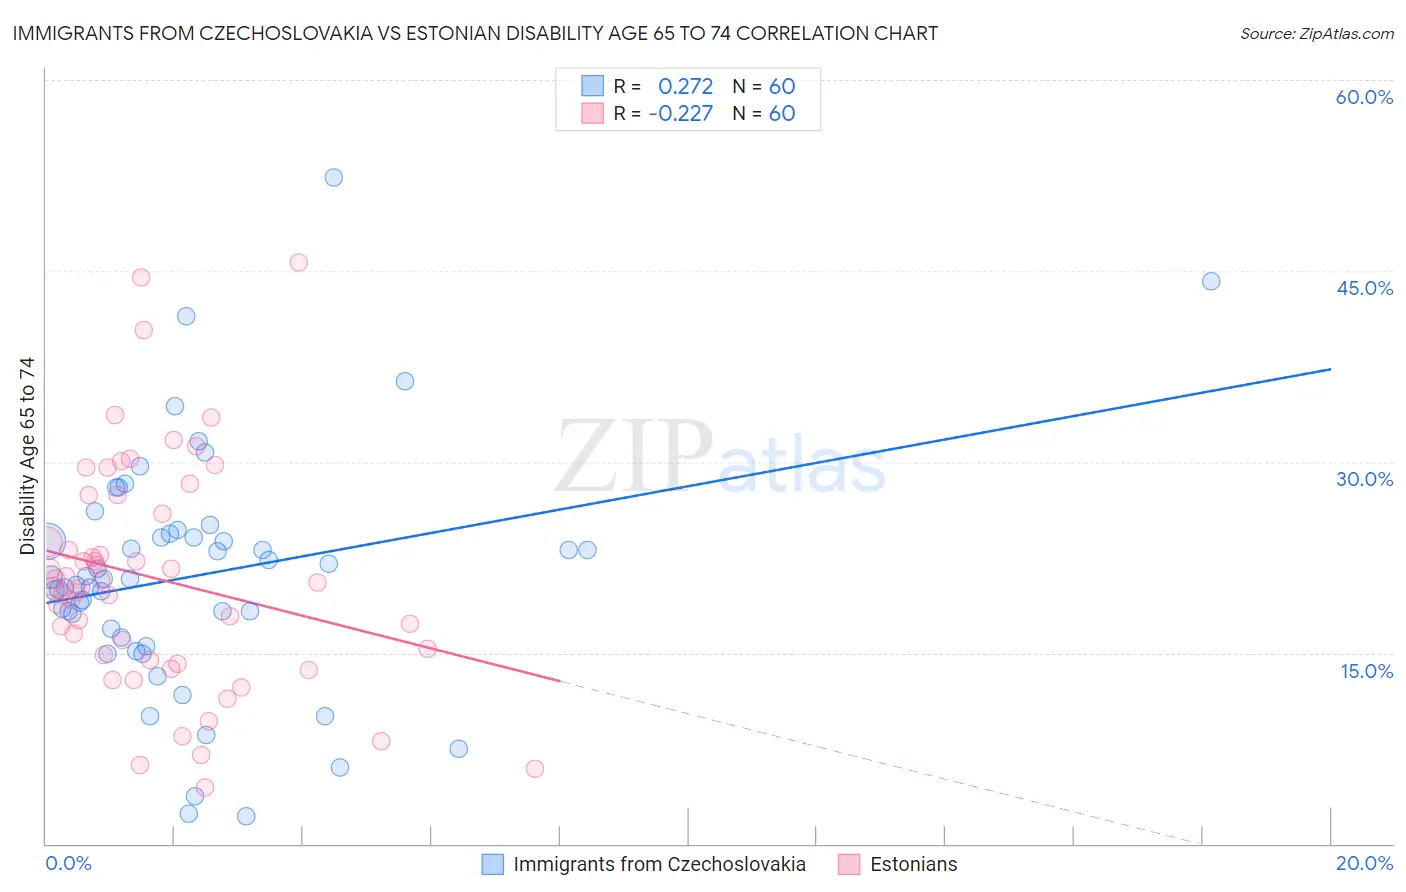
Immigrants from Czechoslovakia vs Estonian Disability Age 65 to 74 Correlation Chart
The statistical analysis conducted on geographies consisting of 195,411,135 people shows a weak positive correlation between the proportion of Immigrants from Czechoslovakia and percentage of population with a disability between the ages 65 and 75 in the United States with a correlation coefficient (R) of 0.272 and weighted average of 21.0%. Similarly, the statistical analysis conducted on geographies consisting of 123,436,234 people shows a weak negative correlation between the proportion of Estonians and percentage of population with a disability between the ages 65 and 75 in the United States with a correlation coefficient (R) of -0.227 and weighted average of 21.4%, a difference of 1.8%.
Disability Age 65 to 74 Correlation Summary
| Measurement | Immigrants from Czechoslovakia | Estonian |
| Minimum | 2.2% | 4.4% |
| Maximum | 52.4% | 45.6% |
| Range | 50.2% | 41.2% |
| Mean | 21.1% | 20.8% |
| Median | 20.8% | 20.4% |
| Interquartile 25% (IQ1) | 16.5% | 14.6% |
| Interquartile 75% (IQ3) | 24.2% | 26.6% |
| Interquartile Range (IQR) | 7.7% | 12.0% |
| Standard Deviation (Sample) | 9.3% | 8.9% |
| Standard Deviation (Population) | 9.2% | 8.8% |
Demographics Similar to Immigrants from Czechoslovakia and Estonians by Disability Age 65 to 74
In terms of disability age 65 to 74, the demographic groups most similar to Immigrants from Czechoslovakia are Immigrants from Japan (21.0%, a difference of 0.050%), Immigrants from Greece (21.0%, a difference of 0.080%), Immigrants from Sweden (21.0%, a difference of 0.10%), Immigrants from Australia (21.0%, a difference of 0.11%), and Immigrants from Northern Europe (21.0%, a difference of 0.12%). Similarly, the demographic groups most similar to Estonians are Asian (21.4%, a difference of 0.020%), Immigrants from Turkey (21.4%, a difference of 0.050%), Immigrants from Croatia (21.3%, a difference of 0.13%), Macedonian (21.3%, a difference of 0.15%), and Immigrants from Austria (21.2%, a difference of 0.58%).
| Demographics | Rating | Rank | Disability Age 65 to 74 |
| Immigrants | Australia | 99.9 /100 | #26 | Exceptional 21.0% |
| Immigrants | Sweden | 99.9 /100 | #27 | Exceptional 21.0% |
| Immigrants | Czechoslovakia | 99.9 /100 | #28 | Exceptional 21.0% |
| Immigrants | Japan | 99.9 /100 | #29 | Exceptional 21.0% |
| Immigrants | Greece | 99.9 /100 | #30 | Exceptional 21.0% |
| Immigrants | Northern Europe | 99.9 /100 | #31 | Exceptional 21.0% |
| Turks | 99.9 /100 | #32 | Exceptional 21.0% |
| Immigrants | Argentina | 99.9 /100 | #33 | Exceptional 21.1% |
| Immigrants | Sri Lanka | 99.9 /100 | #34 | Exceptional 21.1% |
| Bulgarians | 99.9 /100 | #35 | Exceptional 21.1% |
| Immigrants | Switzerland | 99.8 /100 | #36 | Exceptional 21.1% |
| Israelis | 99.8 /100 | #37 | Exceptional 21.2% |
| Russians | 99.8 /100 | #38 | Exceptional 21.2% |
| Argentineans | 99.8 /100 | #39 | Exceptional 21.2% |
| Latvians | 99.8 /100 | #40 | Exceptional 21.2% |
| Immigrants | Austria | 99.8 /100 | #41 | Exceptional 21.2% |
| Macedonians | 99.7 /100 | #42 | Exceptional 21.3% |
| Immigrants | Croatia | 99.7 /100 | #43 | Exceptional 21.3% |
| Estonians | 99.7 /100 | #44 | Exceptional 21.4% |
| Asians | 99.7 /100 | #45 | Exceptional 21.4% |
| Immigrants | Turkey | 99.7 /100 | #46 | Exceptional 21.4% |