Immigrants from Cuba vs Scotch-Irish Ambulatory Disability
COMPARE
Immigrants from Cuba
Scotch-Irish
Ambulatory Disability
Ambulatory Disability Comparison
Immigrants from Cuba
Scotch-Irish
6.5%
AMBULATORY DISABILITY
1.4/ 100
METRIC RATING
247th/ 347
METRIC RANK
6.9%
AMBULATORY DISABILITY
0.0/ 100
METRIC RATING
290th/ 347
METRIC RANK
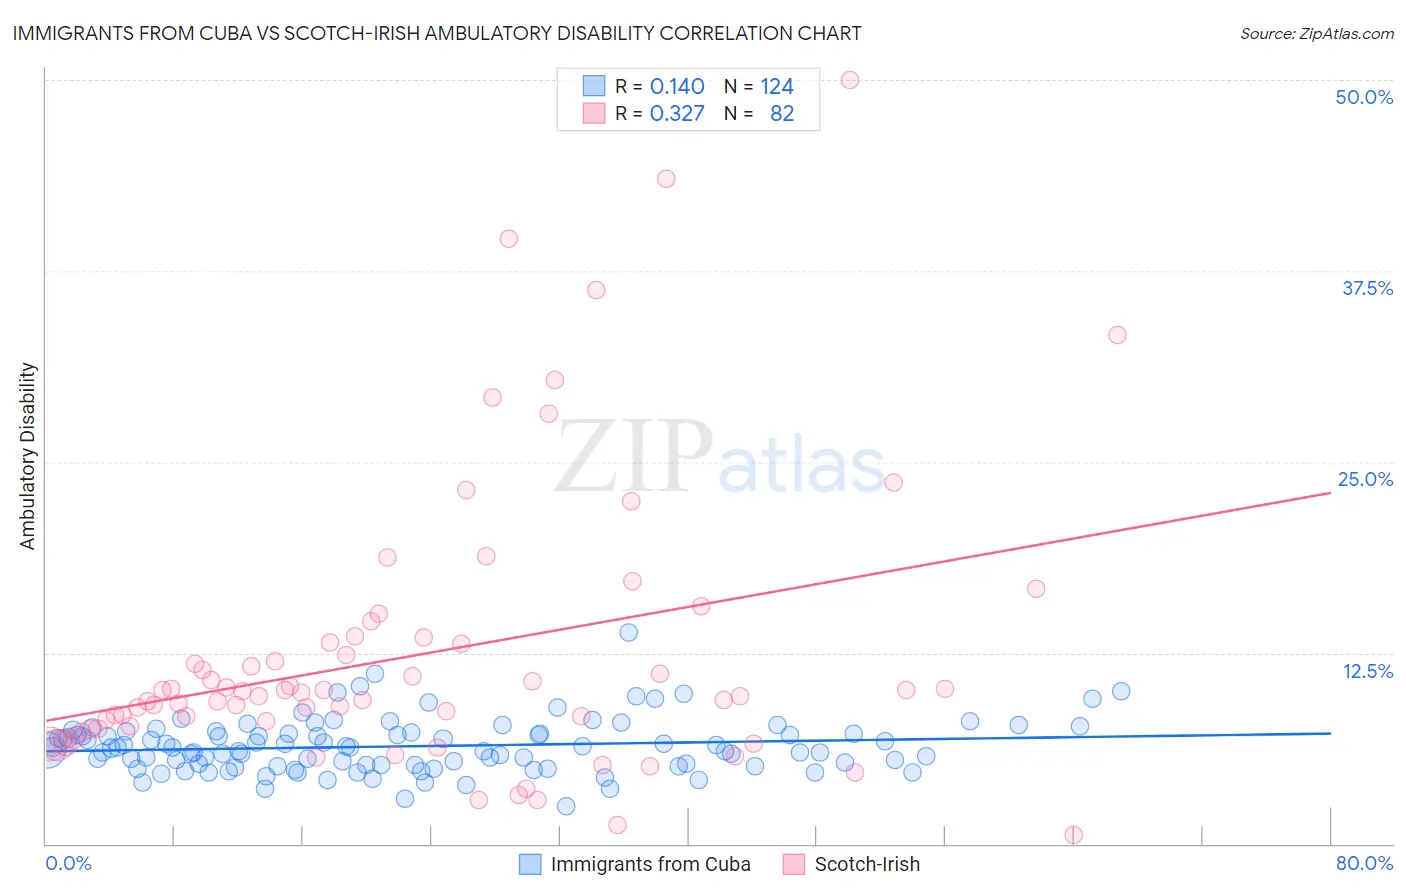
Immigrants from Cuba vs Scotch-Irish Ambulatory Disability Correlation Chart
The statistical analysis conducted on geographies consisting of 325,985,542 people shows a poor positive correlation between the proportion of Immigrants from Cuba and percentage of population with ambulatory disability in the United States with a correlation coefficient (R) of 0.140 and weighted average of 6.5%. Similarly, the statistical analysis conducted on geographies consisting of 548,439,452 people shows a mild positive correlation between the proportion of Scotch-Irish and percentage of population with ambulatory disability in the United States with a correlation coefficient (R) of 0.327 and weighted average of 6.9%, a difference of 6.2%.
Ambulatory Disability Correlation Summary
| Measurement | Immigrants from Cuba | Scotch-Irish |
| Minimum | 2.5% | 0.57% |
| Maximum | 13.8% | 50.0% |
| Range | 11.4% | 49.4% |
| Mean | 6.4% | 12.4% |
| Median | 6.3% | 9.8% |
| Interquartile 25% (IQ1) | 5.2% | 7.5% |
| Interquartile 75% (IQ3) | 7.2% | 13.2% |
| Interquartile Range (IQR) | 2.1% | 5.6% |
| Standard Deviation (Sample) | 1.7% | 9.3% |
| Standard Deviation (Population) | 1.7% | 9.2% |
Similar Demographics by Ambulatory Disability
Demographics Similar to Immigrants from Cuba by Ambulatory Disability
In terms of ambulatory disability, the demographic groups most similar to Immigrants from Cuba are Immigrants from Portugal (6.5%, a difference of 0.020%), Armenian (6.5%, a difference of 0.050%), Tlingit-Haida (6.5%, a difference of 0.070%), German (6.5%, a difference of 0.10%), and Immigrants from Panama (6.5%, a difference of 0.10%).
| Demographics | Rating | Rank | Ambulatory Disability |
| Immigrants | Senegal | 1.7 /100 | #240 | Tragic 6.4% |
| Immigrants | Haiti | 1.6 /100 | #241 | Tragic 6.5% |
| Spaniards | 1.6 /100 | #242 | Tragic 6.5% |
| Germans | 1.5 /100 | #243 | Tragic 6.5% |
| Immigrants | Panama | 1.5 /100 | #244 | Tragic 6.5% |
| Tlingit-Haida | 1.5 /100 | #245 | Tragic 6.5% |
| Armenians | 1.5 /100 | #246 | Tragic 6.5% |
| Immigrants | Cuba | 1.4 /100 | #247 | Tragic 6.5% |
| Immigrants | Portugal | 1.4 /100 | #248 | Tragic 6.5% |
| Native Hawaiians | 1.1 /100 | #249 | Tragic 6.5% |
| Chinese | 1.0 /100 | #250 | Tragic 6.5% |
| Hawaiians | 0.9 /100 | #251 | Tragic 6.5% |
| Immigrants | Bahamas | 0.8 /100 | #252 | Tragic 6.5% |
| Scottish | 0.7 /100 | #253 | Tragic 6.5% |
| Belizeans | 0.7 /100 | #254 | Tragic 6.5% |
Demographics Similar to Scotch-Irish by Ambulatory Disability
In terms of ambulatory disability, the demographic groups most similar to Scotch-Irish are Immigrants from Dominica (6.9%, a difference of 0.030%), West Indian (6.9%, a difference of 0.10%), Cheyenne (6.9%, a difference of 0.16%), Nonimmigrants (6.9%, a difference of 0.17%), and Immigrants from St. Vincent and the Grenadines (6.9%, a difference of 0.40%).
| Demographics | Rating | Rank | Ambulatory Disability |
| Immigrants | Barbados | 0.0 /100 | #283 | Tragic 6.8% |
| Immigrants | Jamaica | 0.0 /100 | #284 | Tragic 6.8% |
| Fijians | 0.0 /100 | #285 | Tragic 6.8% |
| Yakama | 0.0 /100 | #286 | Tragic 6.8% |
| U.S. Virgin Islanders | 0.0 /100 | #287 | Tragic 6.8% |
| Immigrants | Nonimmigrants | 0.0 /100 | #288 | Tragic 6.9% |
| Immigrants | Dominica | 0.0 /100 | #289 | Tragic 6.9% |
| Scotch-Irish | 0.0 /100 | #290 | Tragic 6.9% |
| West Indians | 0.0 /100 | #291 | Tragic 6.9% |
| Cheyenne | 0.0 /100 | #292 | Tragic 6.9% |
| Immigrants | St. Vincent and the Grenadines | 0.0 /100 | #293 | Tragic 6.9% |
| Cape Verdeans | 0.0 /100 | #294 | Tragic 6.9% |
| Crow | 0.0 /100 | #295 | Tragic 6.9% |
| Alaskan Athabascans | 0.0 /100 | #296 | Tragic 6.9% |
| French American Indians | 0.0 /100 | #297 | Tragic 6.9% |