Immigrants from Colombia vs Immigrants from Fiji Self-Care Disability
COMPARE
Immigrants from Colombia
Immigrants from Fiji
Self-Care Disability
Self-Care Disability Comparison
Immigrants from Colombia
Immigrants from Fiji
2.4%
SELF-CARE DISABILITY
88.5/ 100
METRIC RATING
133rd/ 347
METRIC RANK
2.8%
SELF-CARE DISABILITY
0.0/ 100
METRIC RATING
300th/ 347
METRIC RANK
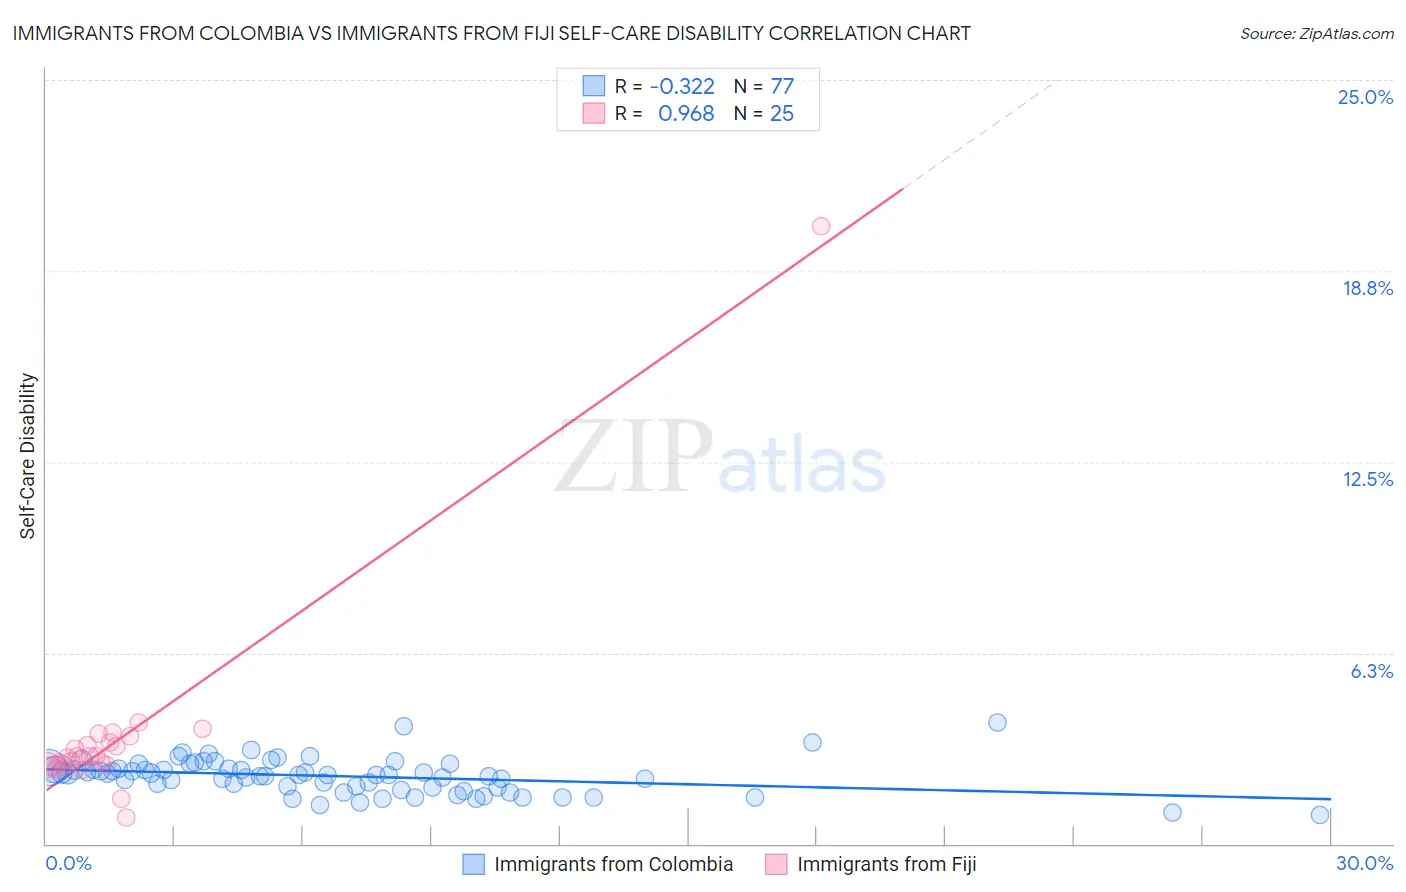
Immigrants from Colombia vs Immigrants from Fiji Self-Care Disability Correlation Chart
The statistical analysis conducted on geographies consisting of 378,342,946 people shows a mild negative correlation between the proportion of Immigrants from Colombia and percentage of population with self-care disability in the United States with a correlation coefficient (R) of -0.322 and weighted average of 2.4%. Similarly, the statistical analysis conducted on geographies consisting of 93,753,839 people shows a perfect positive correlation between the proportion of Immigrants from Fiji and percentage of population with self-care disability in the United States with a correlation coefficient (R) of 0.968 and weighted average of 2.8%, a difference of 15.5%.
Self-Care Disability Correlation Summary
| Measurement | Immigrants from Colombia | Immigrants from Fiji |
| Minimum | 0.93% | 0.86% |
| Maximum | 4.0% | 20.2% |
| Range | 3.0% | 19.4% |
| Mean | 2.2% | 3.5% |
| Median | 2.3% | 2.9% |
| Interquartile 25% (IQ1) | 1.8% | 2.6% |
| Interquartile 75% (IQ3) | 2.5% | 3.4% |
| Interquartile Range (IQR) | 0.62% | 0.86% |
| Standard Deviation (Sample) | 0.56% | 3.5% |
| Standard Deviation (Population) | 0.56% | 3.5% |
Similar Demographics by Self-Care Disability
Demographics Similar to Immigrants from Colombia by Self-Care Disability
In terms of self-care disability, the demographic groups most similar to Immigrants from Colombia are Immigrants from South America (2.4%, a difference of 0.030%), Polish (2.4%, a difference of 0.040%), Russian (2.4%, a difference of 0.040%), Immigrants from Austria (2.4%, a difference of 0.060%), and Immigrants from Romania (2.4%, a difference of 0.090%).
| Demographics | Rating | Rank | Self-Care Disability |
| Hmong | 89.9 /100 | #126 | Excellent 2.4% |
| Colombians | 89.7 /100 | #127 | Excellent 2.4% |
| Immigrants | Hungary | 89.6 /100 | #128 | Excellent 2.4% |
| Immigrants | Romania | 89.3 /100 | #129 | Excellent 2.4% |
| Immigrants | Austria | 89.0 /100 | #130 | Excellent 2.4% |
| Poles | 88.9 /100 | #131 | Excellent 2.4% |
| Immigrants | South America | 88.8 /100 | #132 | Excellent 2.4% |
| Immigrants | Colombia | 88.5 /100 | #133 | Excellent 2.4% |
| Russians | 88.2 /100 | #134 | Excellent 2.4% |
| Laotians | 87.8 /100 | #135 | Excellent 2.4% |
| South American Indians | 87.2 /100 | #136 | Excellent 2.4% |
| Austrians | 87.0 /100 | #137 | Excellent 2.4% |
| Immigrants | Croatia | 86.6 /100 | #138 | Excellent 2.4% |
| Sri Lankans | 86.6 /100 | #139 | Excellent 2.4% |
| Immigrants | Uruguay | 85.4 /100 | #140 | Excellent 2.4% |
Demographics Similar to Immigrants from Fiji by Self-Care Disability
In terms of self-care disability, the demographic groups most similar to Immigrants from Fiji are Pima (2.8%, a difference of 0.090%), Immigrants from St. Vincent and the Grenadines (2.8%, a difference of 0.13%), Immigrants from Belize (2.8%, a difference of 0.28%), Cree (2.8%, a difference of 0.43%), and Immigrants from Guyana (2.8%, a difference of 0.47%).
| Demographics | Rating | Rank | Self-Care Disability |
| Belizeans | 0.0 /100 | #293 | Tragic 2.7% |
| Blackfeet | 0.0 /100 | #294 | Tragic 2.7% |
| Barbadians | 0.0 /100 | #295 | Tragic 2.7% |
| Immigrants | Portugal | 0.0 /100 | #296 | Tragic 2.8% |
| West Indians | 0.0 /100 | #297 | Tragic 2.8% |
| Americans | 0.0 /100 | #298 | Tragic 2.8% |
| Immigrants | Guyana | 0.0 /100 | #299 | Tragic 2.8% |
| Immigrants | Fiji | 0.0 /100 | #300 | Tragic 2.8% |
| Pima | 0.0 /100 | #301 | Tragic 2.8% |
| Immigrants | St. Vincent and the Grenadines | 0.0 /100 | #302 | Tragic 2.8% |
| Immigrants | Belize | 0.0 /100 | #303 | Tragic 2.8% |
| Cree | 0.0 /100 | #304 | Tragic 2.8% |
| Immigrants | West Indies | 0.0 /100 | #305 | Tragic 2.8% |
| Aleuts | 0.0 /100 | #306 | Tragic 2.8% |
| Natives/Alaskans | 0.0 /100 | #307 | Tragic 2.8% |