Immigrants from Caribbean vs Northern European Self-Care Disability
COMPARE
Immigrants from Caribbean
Northern European
Self-Care Disability
Self-Care Disability Comparison
Immigrants from Caribbean
Northern Europeans
2.8%
SELF-CARE DISABILITY
0.0/ 100
METRIC RATING
312th/ 347
METRIC RANK
2.4%
SELF-CARE DISABILITY
92.9/ 100
METRIC RATING
116th/ 347
METRIC RANK
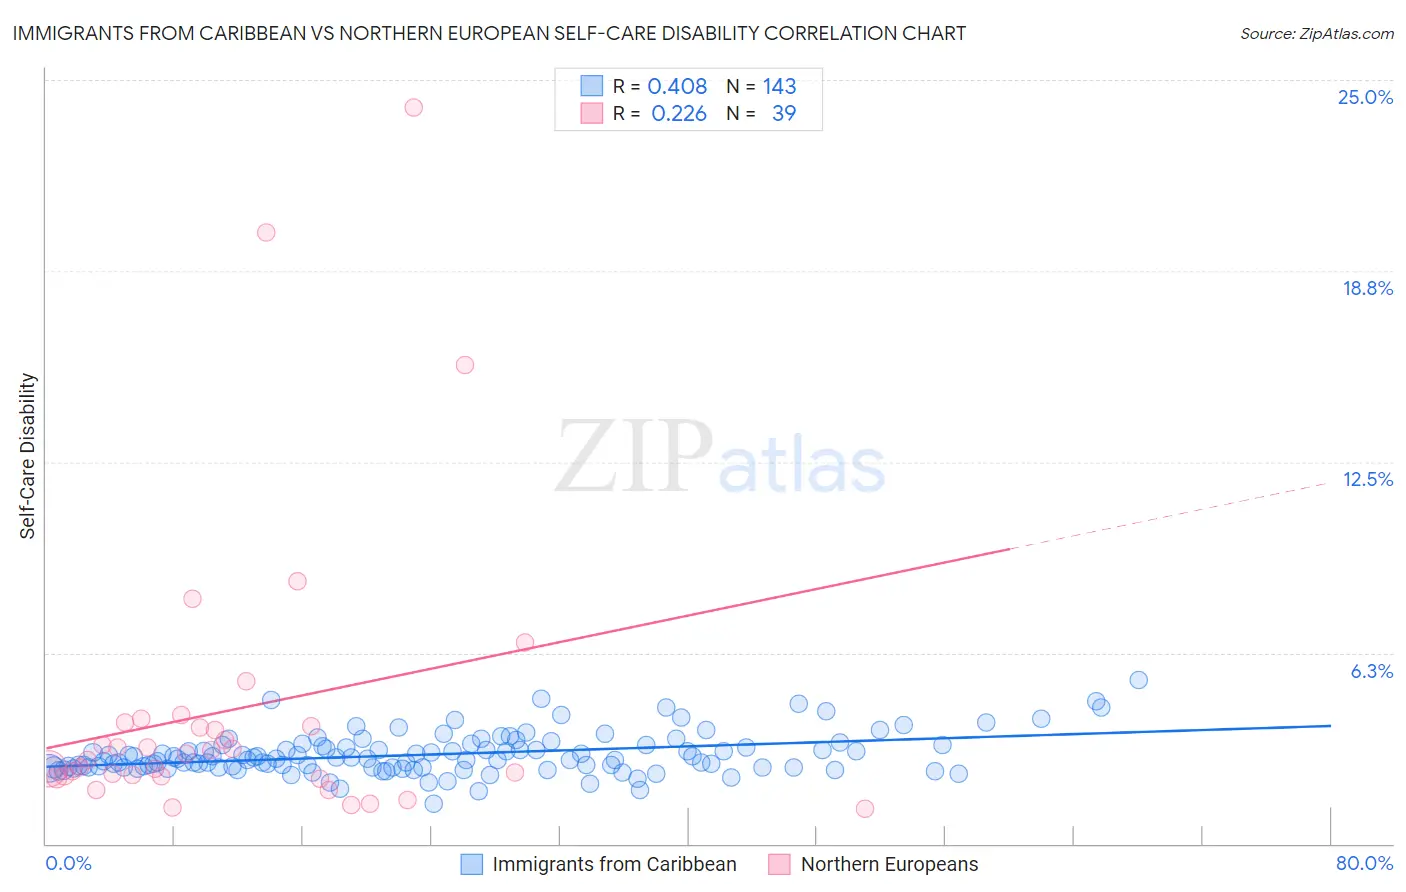
Immigrants from Caribbean vs Northern European Self-Care Disability Correlation Chart
The statistical analysis conducted on geographies consisting of 449,223,668 people shows a moderate positive correlation between the proportion of Immigrants from Caribbean and percentage of population with self-care disability in the United States with a correlation coefficient (R) of 0.408 and weighted average of 2.8%. Similarly, the statistical analysis conducted on geographies consisting of 405,623,897 people shows a weak positive correlation between the proportion of Northern Europeans and percentage of population with self-care disability in the United States with a correlation coefficient (R) of 0.226 and weighted average of 2.4%, a difference of 18.3%.
Self-Care Disability Correlation Summary
| Measurement | Immigrants from Caribbean | Northern European |
| Minimum | 1.3% | 1.2% |
| Maximum | 5.4% | 24.1% |
| Range | 4.1% | 22.9% |
| Mean | 2.9% | 4.4% |
| Median | 2.8% | 3.0% |
| Interquartile 25% (IQ1) | 2.5% | 2.2% |
| Interquartile 75% (IQ3) | 3.2% | 4.0% |
| Interquartile Range (IQR) | 0.74% | 1.8% |
| Standard Deviation (Sample) | 0.67% | 4.9% |
| Standard Deviation (Population) | 0.66% | 4.9% |
Similar Demographics by Self-Care Disability
Demographics Similar to Immigrants from Caribbean by Self-Care Disability
In terms of self-care disability, the demographic groups most similar to Immigrants from Caribbean are Spanish American (2.8%, a difference of 0.030%), Puget Sound Salish (2.8%, a difference of 0.19%), Creek (2.8%, a difference of 0.25%), British West Indian (2.8%, a difference of 0.26%), and Bangladeshi (2.8%, a difference of 0.36%).
| Demographics | Rating | Rank | Self-Care Disability |
| Immigrants | West Indies | 0.0 /100 | #305 | Tragic 2.8% |
| Aleuts | 0.0 /100 | #306 | Tragic 2.8% |
| Natives/Alaskans | 0.0 /100 | #307 | Tragic 2.8% |
| Immigrants | Grenada | 0.0 /100 | #308 | Tragic 2.8% |
| Bangladeshis | 0.0 /100 | #309 | Tragic 2.8% |
| British West Indians | 0.0 /100 | #310 | Tragic 2.8% |
| Puget Sound Salish | 0.0 /100 | #311 | Tragic 2.8% |
| Immigrants | Caribbean | 0.0 /100 | #312 | Tragic 2.8% |
| Spanish Americans | 0.0 /100 | #313 | Tragic 2.8% |
| Creek | 0.0 /100 | #314 | Tragic 2.8% |
| Immigrants | Cuba | 0.0 /100 | #315 | Tragic 2.8% |
| Menominee | 0.0 /100 | #316 | Tragic 2.8% |
| Immigrants | Dominica | 0.0 /100 | #317 | Tragic 2.8% |
| Assyrians/Chaldeans/Syriacs | 0.0 /100 | #318 | Tragic 2.8% |
| Spanish American Indians | 0.0 /100 | #319 | Tragic 2.9% |
Demographics Similar to Northern Europeans by Self-Care Disability
In terms of self-care disability, the demographic groups most similar to Northern Europeans are Immigrants from North Macedonia (2.4%, a difference of 0.050%), Immigrants from Hong Kong (2.4%, a difference of 0.050%), South American (2.4%, a difference of 0.060%), Taiwanese (2.4%, a difference of 0.060%), and Scandinavian (2.4%, a difference of 0.12%).
| Demographics | Rating | Rank | Self-Care Disability |
| Slovenes | 94.1 /100 | #109 | Exceptional 2.4% |
| Immigrants | Africa | 93.7 /100 | #110 | Exceptional 2.4% |
| Serbians | 93.6 /100 | #111 | Exceptional 2.4% |
| Scandinavians | 93.5 /100 | #112 | Exceptional 2.4% |
| South Americans | 93.2 /100 | #113 | Exceptional 2.4% |
| Immigrants | North Macedonia | 93.1 /100 | #114 | Exceptional 2.4% |
| Immigrants | Hong Kong | 93.1 /100 | #115 | Exceptional 2.4% |
| Northern Europeans | 92.9 /100 | #116 | Exceptional 2.4% |
| Taiwanese | 92.5 /100 | #117 | Exceptional 2.4% |
| Immigrants | Canada | 92.0 /100 | #118 | Exceptional 2.4% |
| Immigrants | Sierra Leone | 91.8 /100 | #119 | Exceptional 2.4% |
| Uruguayans | 91.5 /100 | #120 | Exceptional 2.4% |
| Peruvians | 91.3 /100 | #121 | Exceptional 2.4% |
| Belgians | 90.9 /100 | #122 | Exceptional 2.4% |
| Immigrants | Nigeria | 90.3 /100 | #123 | Exceptional 2.4% |