Immigrants from Burma/Myanmar vs Palestinian Hearing Disability

COMPARE

Immigrants from Burma/Myanmar
Race
Ancestry
AfghanAfricanAlaska NativeAlaskan AthabascanAlbanianAleutAlsatianAmericanApacheArabArapahoArgentineanArmenianAssyrian/Chaldean/SyriacAustralianAustrianBahamianBangladeshiBarbadianBasqueBelgianBelizeanBermudanBhutaneseBlackfeetBolivianBrazilianBritishBritish West IndianBulgarianBurmeseCajunCambodianCanadianCape VerdeanCarpatho RusynCelticCentral AmericanCentral American IndianCherokeeCheyenneChickasawChileanChineseChippewaChoctawColombianColvilleComancheCosta RicanCreeCreekCroatianCrowCubanCypriotCzechCzechoslovakianDanishDelawareDominicanDutchDutch West IndianEastern EuropeanEcuadorianEgyptianEnglishEstonianEthiopianEuropeanFijianFilipinoFinnishFrenchFrench American IndianFrench CanadianGermanGerman RussianGhanaianGreekGuamanian/ChamorroGuatemalanGuyaneseHaitianHmongHonduranHopiHoumaHungarianIcelanderIndian (Asian)IndonesianInupiatIranianIraqiIrishIroquoisIsraeliItalianJamaicanJapaneseJordanianKenyanKiowaKoreanLaotianLatvianLebaneseLiberianLithuanianLumbeeLuxembourgerMacedonianMalaysianMalteseMarshalleseMenomineeMexicanMexican American IndianMongolianMoroccanNative HawaiianNavajoNepaleseNew ZealanderNicaraguanNigerianNorthern EuropeanNorwegianOkinawanOsageOttawaPaiutePakistaniPanamanianParaguayanPennsylvania GermanPeruvianPimaPolishPortuguesePotawatomiPuebloPuerto RicanPuget Sound SalishRomanianRussianSalvadoranSamoanScandinavianScotch-IrishScottishSeminoleSenegaleseSerbianShoshoneSierra LeoneanSiouxSlavicSlovakSloveneSomaliSouth AfricanSouth AmericanSouth American IndianSoviet UnionSpaniardSpanishSpanish AmericanSpanish American IndianSri LankanSubsaharan AfricanSudaneseSwedishSwissSyrianTaiwaneseThaiTlingit-HaidaTohono O'OdhamTonganTrinidadian and TobagonianTsimshianTurkishU.S. Virgin IslanderUgandanUkrainianUruguayanUteVenezuelanVietnameseWelshWest IndianYakamaYaquiYugoslavianYumanYup'ikZimbabwean
Immigration
NonimmigrantsImmigrantsAfghanistanAfricaAlbaniaArgentinaArmeniaAsiaAustraliaAustriaBahamasBangladeshBarbadosBelarusBelgiumBelizeBoliviaBosnia and HerzegovinaBrazilBulgariaBurma/MyanmarCabo VerdeCambodiaCameroonCanadaCaribbeanCentral AmericaChileChinaColombiaCongoCosta RicaCroatiaCubaCzechoslovakiaDenmarkDominicaDominican RepublicEastern AfricaEastern AsiaEastern EuropeEcuadorEgyptEl SalvadorEnglandEritreaEthiopiaEuropeFijiFranceGermanyGhanaGreeceGrenadaGuatemalaGuyanaHaitiHondurasHong KongHungaryIndiaIndonesiaIranIraqIrelandIsraelItalyJamaicaJapanJordanKazakhstanKenyaKoreaKuwaitLaosLatin AmericaLatviaLebanonLiberiaLithuaniaMalaysiaMexicoMicronesiaMiddle AfricaMoldovaMoroccoNepalNetherlandsNicaraguaNigeriaNorth AmericaNorth MacedoniaNorthern AfricaNorthern EuropeNorwayOceaniaPakistanPanamaPeruPhilippinesPolandPortugalRomaniaRussiaSaudi ArabiaScotlandSenegalSerbiaSierra LeoneSingaporeSomaliaSouth AfricaSouth AmericaSouth Central AsiaSouth Eastern AsiaSouthern EuropeSpainSri LankaSt. Vincent and the GrenadinesSudanSwedenSwitzerlandSyriaTaiwanThailandTrinidad and TobagoTurkeyUgandaUkraineUruguayUzbekistanVenezuelaVietnamWest IndiesWestern AfricaWestern AsiaWestern EuropeYemenZaireZimbabweAzores
Palestinian
Race
Ancestry
AfghanAfricanAlaska NativeAlaskan AthabascanAlbanianAleutAlsatianAmericanApacheArabArapahoArgentineanArmenianAssyrian/Chaldean/SyriacAustralianAustrianBahamianBangladeshiBarbadianBasqueBelgianBelizeanBermudanBhutaneseBlackfeetBolivianBrazilianBritishBritish West IndianBulgarianBurmeseCajunCambodianCanadianCape VerdeanCarpatho RusynCelticCentral AmericanCentral American IndianCherokeeCheyenneChickasawChileanChineseChippewaChoctawColombianColvilleComancheCosta RicanCreeCreekCroatianCrowCubanCypriotCzechCzechoslovakianDanishDelawareDominicanDutchDutch West IndianEastern EuropeanEcuadorianEgyptianEnglishEstonianEthiopianEuropeanFijianFilipinoFinnishFrenchFrench American IndianFrench CanadianGermanGerman RussianGhanaianGreekGuamanian/ChamorroGuatemalanGuyaneseHaitianHmongHonduranHopiHoumaHungarianIcelanderIndian (Asian)IndonesianInupiatIranianIraqiIrishIroquoisIsraeliItalianJamaicanJapaneseJordanianKenyanKiowaKoreanLaotianLatvianLebaneseLiberianLithuanianLumbeeLuxembourgerMacedonianMalaysianMalteseMarshalleseMenomineeMexicanMexican American IndianMongolianMoroccanNative HawaiianNavajoNepaleseNew ZealanderNicaraguanNigerianNorthern EuropeanNorwegianOkinawanOsageOttawaPaiutePakistaniPalestinianPanamanianParaguayanPennsylvania GermanPeruvianPimaPolishPortuguesePotawatomiPuebloPuerto RicanPuget Sound SalishRomanianRussianSalvadoranSamoanScandinavianScotch-IrishScottishSeminoleSenegaleseSerbianShoshoneSierra LeoneanSiouxSlavicSlovakSloveneSomaliSouth AfricanSouth AmericanSouth American IndianSoviet UnionSpaniardSpanishSpanish AmericanSpanish American IndianSri LankanSubsaharan AfricanSudaneseSwedishSwissSyrianTaiwaneseThaiTlingit-HaidaTohono O'OdhamTonganTrinidadian and TobagonianTsimshianTurkishU.S. Virgin IslanderUgandanUkrainianUruguayanUteVenezuelanVietnameseWelshWest IndianYakamaYaquiYugoslavianYumanYup'ikZimbabwean
Immigration
NonimmigrantsImmigrantsAfghanistanAfricaAlbaniaArgentinaArmeniaAsiaAustraliaAustriaBahamasBangladeshBarbadosBelarusBelgiumBelizeBoliviaBosnia and HerzegovinaBrazilBulgariaCabo VerdeCambodiaCameroonCanadaCaribbeanCentral AmericaChileChinaColombiaCongoCosta RicaCroatiaCubaCzechoslovakiaDenmarkDominicaDominican RepublicEastern AfricaEastern AsiaEastern EuropeEcuadorEgyptEl SalvadorEnglandEritreaEthiopiaEuropeFijiFranceGermanyGhanaGreeceGrenadaGuatemalaGuyanaHaitiHondurasHong KongHungaryIndiaIndonesiaIranIraqIrelandIsraelItalyJamaicaJapanJordanKazakhstanKenyaKoreaKuwaitLaosLatin AmericaLatviaLebanonLiberiaLithuaniaMalaysiaMexicoMicronesiaMiddle AfricaMoldovaMoroccoNepalNetherlandsNicaraguaNigeriaNorth AmericaNorth MacedoniaNorthern AfricaNorthern EuropeNorwayOceaniaPakistanPanamaPeruPhilippinesPolandPortugalRomaniaRussiaSaudi ArabiaScotlandSenegalSerbiaSierra LeoneSingaporeSomaliaSouth AfricaSouth AmericaSouth Central AsiaSouth Eastern AsiaSouthern EuropeSpainSri LankaSt. Vincent and the GrenadinesSudanSwedenSwitzerlandSyriaTaiwanThailandTrinidad and TobagoTurkeyUgandaUkraineUruguayUzbekistanVenezuelaVietnamWest IndiesWestern AfricaWestern AsiaWestern EuropeYemenZaireZimbabweAzores
Hearing Disability
Income
Poverty
Unemployment
Labor Participation
Family Structure
Vehicle Availability
Education Level
Disability

Hearing Disability Comparison

Immigrants from Burma/Myanmar

Palestinians

Good
Good
2.9%
HEARING DISABILITY
69.5/ 100
METRIC RATING
158th/ 347
METRIC RANK
2.9%
HEARING DISABILITY
73.6/ 100
METRIC RATING
150th/ 347
METRIC RANK

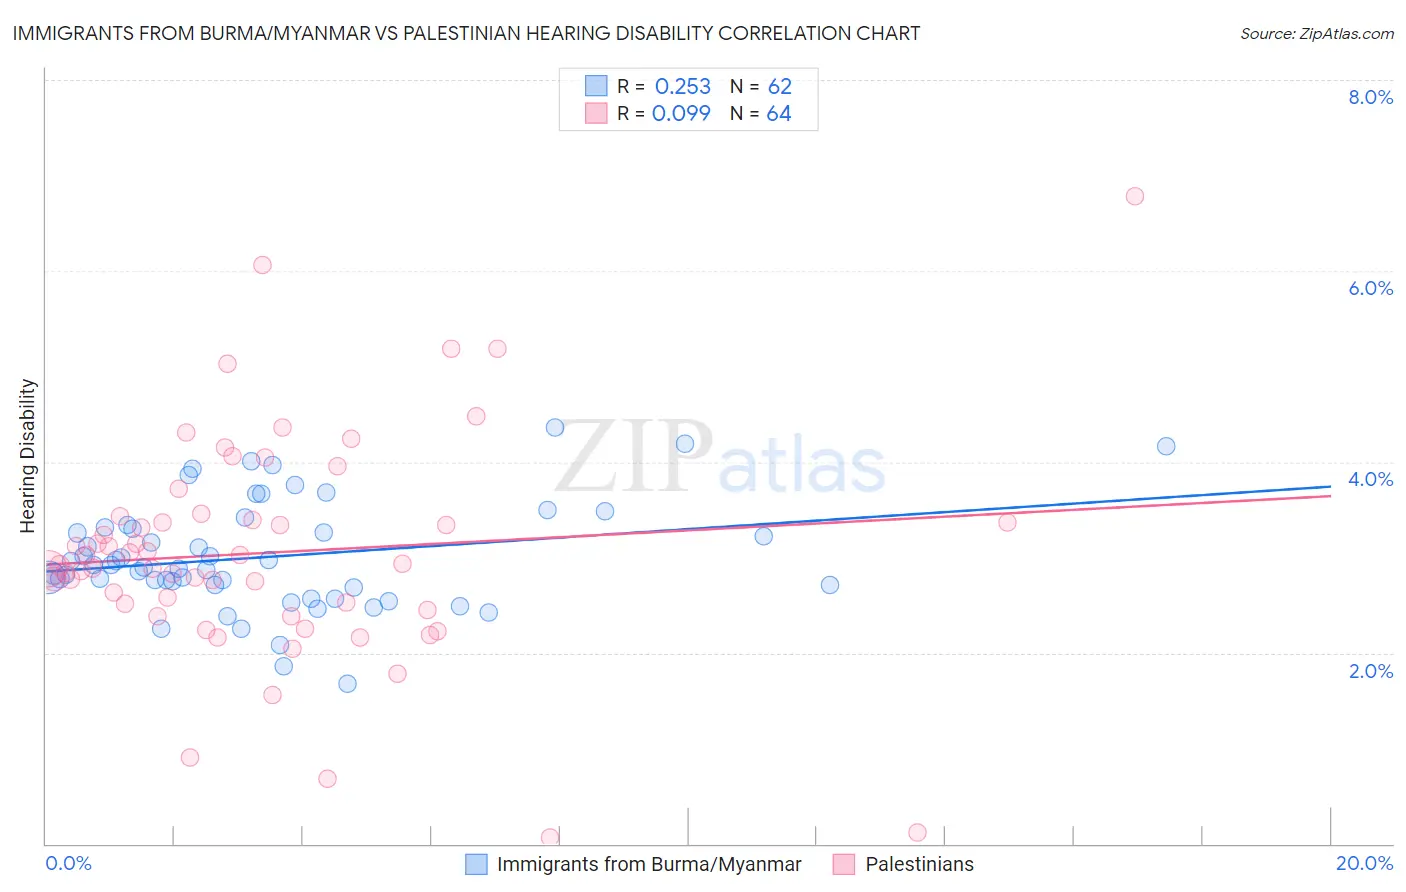
Immigrants from Burma/Myanmar vs Palestinian Hearing Disability Correlation Chart

The statistical analysis conducted on geographies consisting of 172,316,169 people shows a weak positive correlation between the proportion of Immigrants from Burma/Myanmar and percentage of population with hearing disability in the United States with a correlation coefficient (R) of 0.253 and weighted average of 2.9%. Similarly, the statistical analysis conducted on geographies consisting of 216,454,064 people shows a slight positive correlation between the proportion of Palestinians and percentage of population with hearing disability in the United States with a correlation coefficient (R) of 0.099 and weighted average of 2.9%, a difference of 0.49%.
Immigrants from Burma/Myanmar vs Palestinian Hearing Disability

Hearing Disability Correlation Summary

MeasurementImmigrants from Burma/MyanmarPalestinian
Minimum1.7%0.070%
Maximum4.4%6.8%
Range2.7%6.7%
Mean3.0%3.0%
Median2.9%2.9%
Interquartile 25% (IQ1)2.7%2.5%
Interquartile 75% (IQ3)3.3%3.4%
Interquartile Range (IQR)0.60%0.93%
Standard Deviation (Sample)0.56%1.2%
Standard Deviation (Population)0.56%1.2%

Demographics Similar to Immigrants from Burma/Myanmar and Palestinians by Hearing Disability

In terms of hearing disability, the demographic groups most similar to Immigrants from Burma/Myanmar are Immigrants from Kazakhstan (2.9%, a difference of 0.010%), Immigrants from Poland (2.9%, a difference of 0.080%), Costa Rican (2.9%, a difference of 0.22%), Immigrants from Lebanon (2.9%, a difference of 0.23%), and Immigrants from Australia (2.9%, a difference of 0.23%). Similarly, the demographic groups most similar to Palestinians are Immigrants from France (2.9%, a difference of 0.060%), Immigrants from Lithuania (2.9%, a difference of 0.070%), Sudanese (2.9%, a difference of 0.18%), Immigrants from Lebanon (2.9%, a difference of 0.25%), and Costa Rican (2.9%, a difference of 0.27%).
DemographicsRating | RankHearing Disability
Immigrants | Bulgaria
79.2
/100
|
#144
Good
2.9%
Immigrants | Congo
78.9
/100
|
#145
Good
2.9%
Brazilians
78.7
/100
|
#146
Good
2.9%
Tongans
78.6
/100
|
#147
Good
2.9%
Immigrants | Russia
77.7
/100
|
#148
Good
2.9%
Immigrants | Panama
76.9
/100
|
#149
Good
2.9%
Palestinians
73.6
/100
|
#150
Good
2.9%
Immigrants | France
73.1
/100
|
#151
Good
2.9%
Immigrants | Lithuania
73.0
/100
|
#152
Good
2.9%
Sudanese
72.1
/100
|
#153
Good
2.9%
Immigrants | Lebanon
71.5
/100
|
#154
Good
2.9%
Costa Ricans
71.4
/100
|
#155
Good
2.9%
Immigrants | Poland
70.2
/100
|
#156
Good
2.9%
Immigrants | Kazakhstan
69.6
/100
|
#157
Good
2.9%
Immigrants | Burma/Myanmar
69.5
/100
|
#158
Good
2.9%
Immigrants | Australia
67.4
/100
|
#159
Good
2.9%
Immigrants | Fiji
67.1
/100
|
#160
Good
2.9%
Albanians
66.6
/100
|
#161
Good
2.9%
Immigrants | Japan
66.3
/100
|
#162
Good
2.9%
Immigrants | Central America
64.9
/100
|
#163
Good
3.0%
Immigrants | Cambodia
64.8
/100
|
#164
Good
3.0%