Immigrants from Brazil vs Puerto Rican Disability Age 65 to 74
COMPARE
Immigrants from Brazil
Puerto Rican
Disability Age 65 to 74
Disability Age 65 to 74 Comparison
Immigrants from Brazil
Puerto Ricans
21.9%
DISABILITY AGE 65 TO 74
98.5/ 100
METRIC RATING
83rd/ 347
METRIC RANK
29.1%
DISABILITY AGE 65 TO 74
0.0/ 100
METRIC RATING
323rd/ 347
METRIC RANK
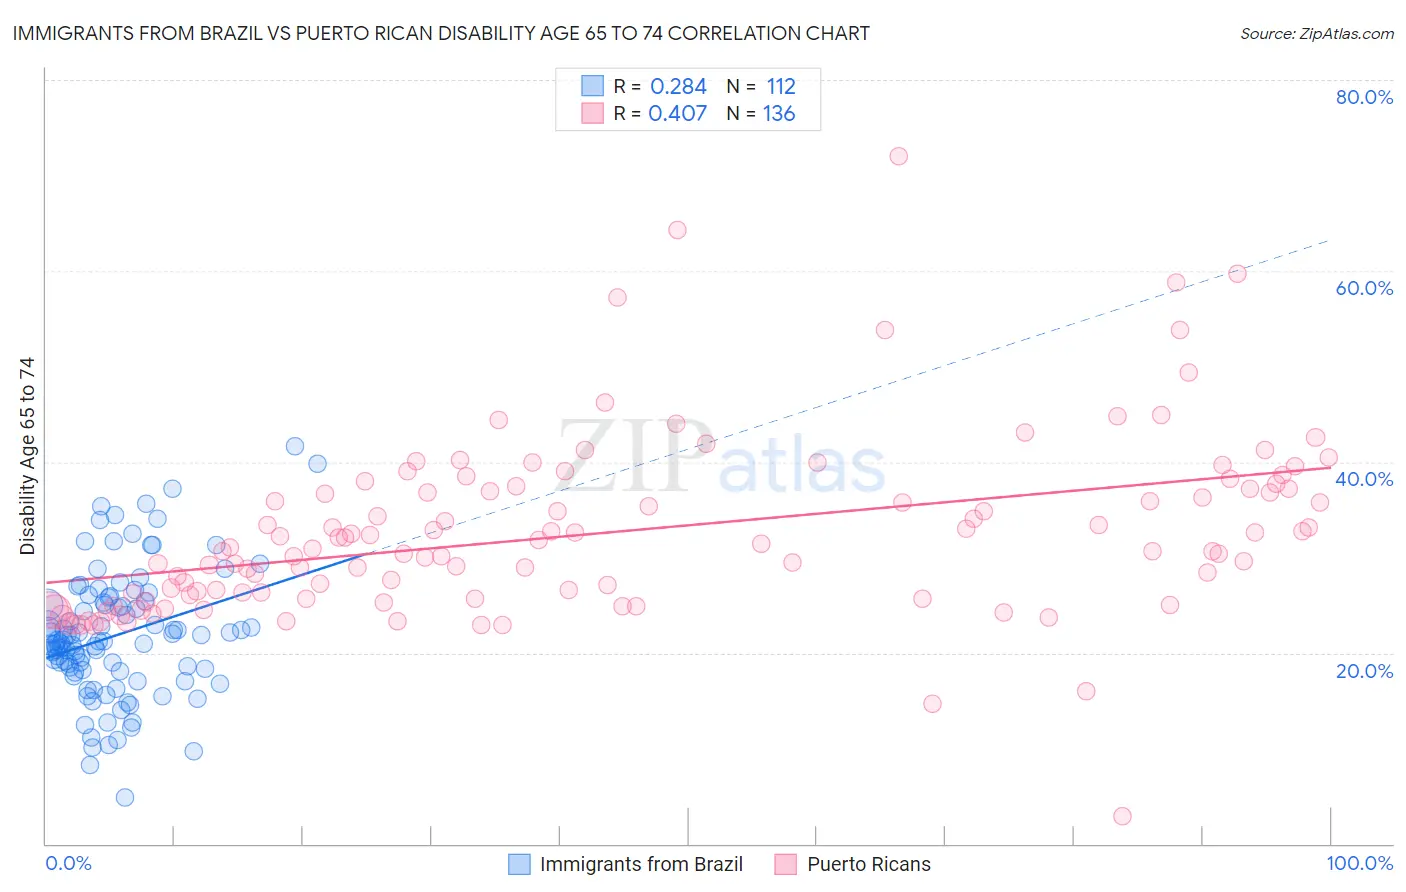
Immigrants from Brazil vs Puerto Rican Disability Age 65 to 74 Correlation Chart
The statistical analysis conducted on geographies consisting of 342,588,968 people shows a weak positive correlation between the proportion of Immigrants from Brazil and percentage of population with a disability between the ages 65 and 75 in the United States with a correlation coefficient (R) of 0.284 and weighted average of 21.9%. Similarly, the statistical analysis conducted on geographies consisting of 526,448,167 people shows a moderate positive correlation between the proportion of Puerto Ricans and percentage of population with a disability between the ages 65 and 75 in the United States with a correlation coefficient (R) of 0.407 and weighted average of 29.1%, a difference of 33.1%.
Disability Age 65 to 74 Correlation Summary
| Measurement | Immigrants from Brazil | Puerto Rican |
| Minimum | 4.9% | 2.9% |
| Maximum | 41.7% | 72.0% |
| Range | 36.8% | 69.1% |
| Mean | 21.9% | 32.6% |
| Median | 21.2% | 31.0% |
| Interquartile 25% (IQ1) | 18.1% | 25.9% |
| Interquartile 75% (IQ3) | 25.3% | 37.2% |
| Interquartile Range (IQR) | 7.2% | 11.3% |
| Standard Deviation (Sample) | 6.7% | 9.5% |
| Standard Deviation (Population) | 6.7% | 9.5% |
Similar Demographics by Disability Age 65 to 74
Demographics Similar to Immigrants from Brazil by Disability Age 65 to 74
In terms of disability age 65 to 74, the demographic groups most similar to Immigrants from Brazil are Immigrants from Spain (21.9%, a difference of 0.020%), Immigrants from Lebanon (21.9%, a difference of 0.12%), Immigrants from Indonesia (21.9%, a difference of 0.17%), South African (21.9%, a difference of 0.20%), and Croatian (21.8%, a difference of 0.43%).
| Demographics | Rating | Rank | Disability Age 65 to 74 |
| Greeks | 99.0 /100 | #76 | Exceptional 21.8% |
| Immigrants | Poland | 99.0 /100 | #77 | Exceptional 21.8% |
| Immigrants | Eastern Europe | 99.0 /100 | #78 | Exceptional 21.8% |
| Venezuelans | 99.0 /100 | #79 | Exceptional 21.8% |
| Immigrants | Norway | 98.9 /100 | #80 | Exceptional 21.8% |
| Croatians | 98.9 /100 | #81 | Exceptional 21.8% |
| Immigrants | Indonesia | 98.7 /100 | #82 | Exceptional 21.9% |
| Immigrants | Brazil | 98.5 /100 | #83 | Exceptional 21.9% |
| Immigrants | Spain | 98.5 /100 | #84 | Exceptional 21.9% |
| Immigrants | Lebanon | 98.4 /100 | #85 | Exceptional 21.9% |
| South Africans | 98.4 /100 | #86 | Exceptional 21.9% |
| Australians | 98.0 /100 | #87 | Exceptional 22.0% |
| Immigrants | Netherlands | 97.9 /100 | #88 | Exceptional 22.0% |
| Immigrants | Kuwait | 97.9 /100 | #89 | Exceptional 22.0% |
| Italians | 97.9 /100 | #90 | Exceptional 22.0% |
Demographics Similar to Puerto Ricans by Disability Age 65 to 74
In terms of disability age 65 to 74, the demographic groups most similar to Puerto Ricans are Seminole (29.4%, a difference of 0.97%), Dutch West Indian (29.6%, a difference of 1.4%), Yakama (29.6%, a difference of 1.7%), Apache (29.7%, a difference of 1.8%), and Aleut (28.4%, a difference of 2.5%).
| Demographics | Rating | Rank | Disability Age 65 to 74 |
| Crow | 0.0 /100 | #316 | Tragic 27.9% |
| Immigrants | Armenia | 0.0 /100 | #317 | Tragic 28.0% |
| Nepalese | 0.0 /100 | #318 | Tragic 28.0% |
| Arapaho | 0.0 /100 | #319 | Tragic 28.1% |
| Cherokee | 0.0 /100 | #320 | Tragic 28.2% |
| Comanche | 0.0 /100 | #321 | Tragic 28.3% |
| Aleuts | 0.0 /100 | #322 | Tragic 28.4% |
| Puerto Ricans | 0.0 /100 | #323 | Tragic 29.1% |
| Seminole | 0.0 /100 | #324 | Tragic 29.4% |
| Dutch West Indians | 0.0 /100 | #325 | Tragic 29.6% |
| Yakama | 0.0 /100 | #326 | Tragic 29.6% |
| Apache | 0.0 /100 | #327 | Tragic 29.7% |
| Hopi | 0.0 /100 | #328 | Tragic 30.0% |
| Choctaw | 0.0 /100 | #329 | Tragic 30.2% |
| Creek | 0.0 /100 | #330 | Tragic 30.2% |