Immigrants from Brazil vs Cambodian Disability Age 65 to 74
COMPARE
Immigrants from Brazil
Cambodian
Disability Age 65 to 74
Disability Age 65 to 74 Comparison
Immigrants from Brazil
Cambodians
21.9%
DISABILITY AGE 65 TO 74
98.5/ 100
METRIC RATING
83rd/ 347
METRIC RANK
21.8%
DISABILITY AGE 65 TO 74
99.0/ 100
METRIC RATING
74th/ 347
METRIC RANK
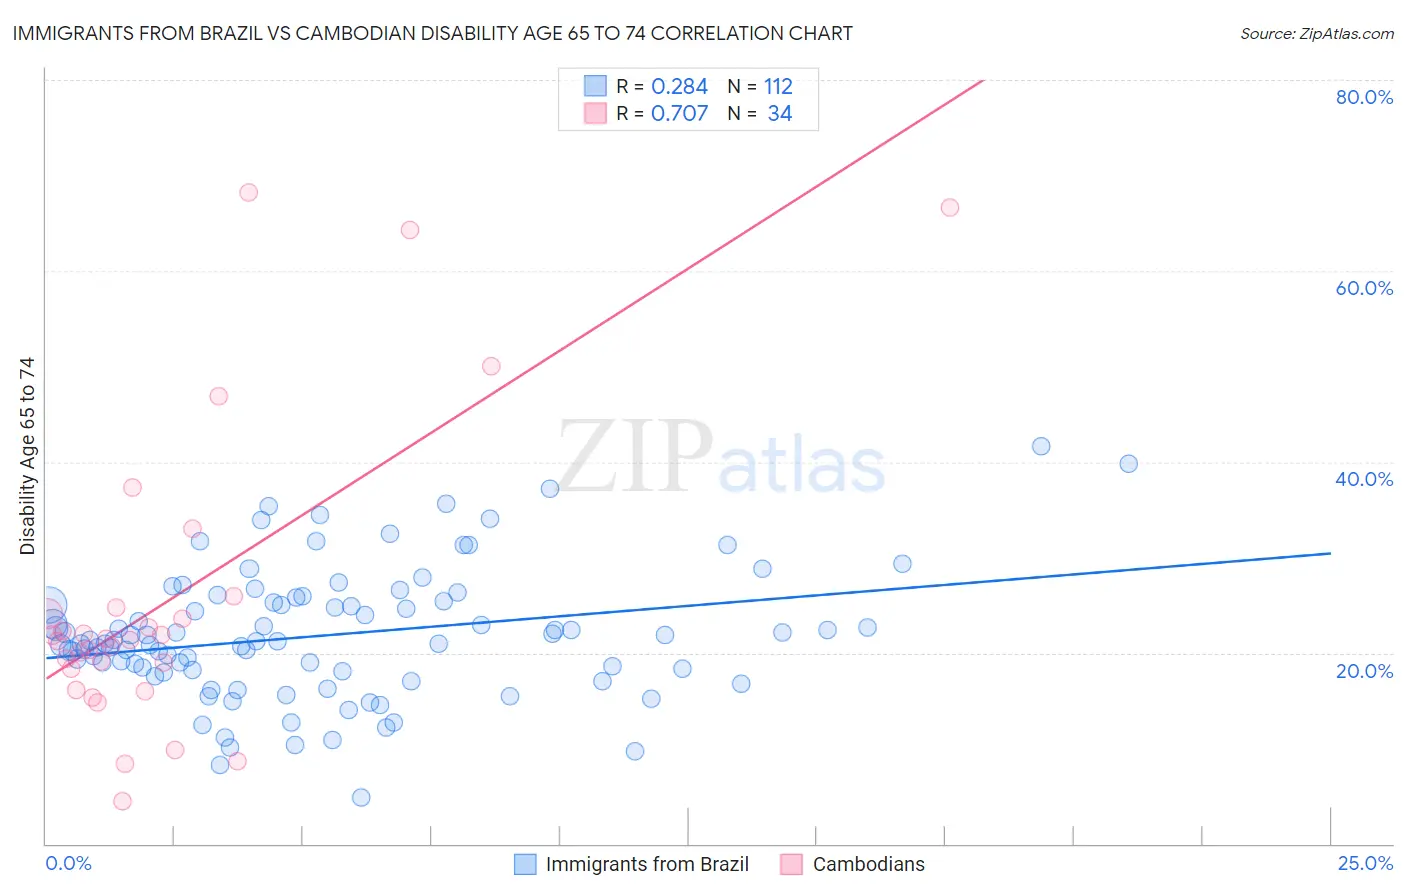
Immigrants from Brazil vs Cambodian Disability Age 65 to 74 Correlation Chart
The statistical analysis conducted on geographies consisting of 342,588,968 people shows a weak positive correlation between the proportion of Immigrants from Brazil and percentage of population with a disability between the ages 65 and 75 in the United States with a correlation coefficient (R) of 0.284 and weighted average of 21.9%. Similarly, the statistical analysis conducted on geographies consisting of 102,419,029 people shows a strong positive correlation between the proportion of Cambodians and percentage of population with a disability between the ages 65 and 75 in the United States with a correlation coefficient (R) of 0.707 and weighted average of 21.8%, a difference of 0.66%.
Disability Age 65 to 74 Correlation Summary
| Measurement | Immigrants from Brazil | Cambodian |
| Minimum | 4.9% | 4.4% |
| Maximum | 41.7% | 68.2% |
| Range | 36.8% | 63.8% |
| Mean | 21.9% | 25.6% |
| Median | 21.2% | 21.4% |
| Interquartile 25% (IQ1) | 18.1% | 18.3% |
| Interquartile 75% (IQ3) | 25.3% | 24.7% |
| Interquartile Range (IQR) | 7.2% | 6.4% |
| Standard Deviation (Sample) | 6.7% | 15.9% |
| Standard Deviation (Population) | 6.7% | 15.6% |
Demographics Similar to Immigrants from Brazil and Cambodians by Disability Age 65 to 74
In terms of disability age 65 to 74, the demographic groups most similar to Immigrants from Brazil are Immigrants from Spain (21.9%, a difference of 0.020%), Immigrants from Lebanon (21.9%, a difference of 0.12%), Immigrants from Indonesia (21.9%, a difference of 0.17%), South African (21.9%, a difference of 0.20%), and Croatian (21.8%, a difference of 0.43%). Similarly, the demographic groups most similar to Cambodians are Immigrants from Venezuela (21.8%, a difference of 0.010%), Mongolian (21.8%, a difference of 0.020%), Greek (21.8%, a difference of 0.030%), Immigrants from Poland (21.8%, a difference of 0.090%), and Immigrants from Eastern Europe (21.8%, a difference of 0.14%).
| Demographics | Rating | Rank | Disability Age 65 to 74 |
| Immigrants | Scotland | 99.3 /100 | #68 | Exceptional 21.7% |
| Immigrants | Egypt | 99.2 /100 | #69 | Exceptional 21.7% |
| Chinese | 99.2 /100 | #70 | Exceptional 21.7% |
| Immigrants | Belarus | 99.2 /100 | #71 | Exceptional 21.7% |
| Immigrants | Hungary | 99.2 /100 | #72 | Exceptional 21.7% |
| Immigrants | Venezuela | 99.0 /100 | #73 | Exceptional 21.8% |
| Cambodians | 99.0 /100 | #74 | Exceptional 21.8% |
| Mongolians | 99.0 /100 | #75 | Exceptional 21.8% |
| Greeks | 99.0 /100 | #76 | Exceptional 21.8% |
| Immigrants | Poland | 99.0 /100 | #77 | Exceptional 21.8% |
| Immigrants | Eastern Europe | 99.0 /100 | #78 | Exceptional 21.8% |
| Venezuelans | 99.0 /100 | #79 | Exceptional 21.8% |
| Immigrants | Norway | 98.9 /100 | #80 | Exceptional 21.8% |
| Croatians | 98.9 /100 | #81 | Exceptional 21.8% |
| Immigrants | Indonesia | 98.7 /100 | #82 | Exceptional 21.9% |
| Immigrants | Brazil | 98.5 /100 | #83 | Exceptional 21.9% |
| Immigrants | Spain | 98.5 /100 | #84 | Exceptional 21.9% |
| Immigrants | Lebanon | 98.4 /100 | #85 | Exceptional 21.9% |
| South Africans | 98.4 /100 | #86 | Exceptional 21.9% |
| Australians | 98.0 /100 | #87 | Exceptional 22.0% |
| Immigrants | Netherlands | 97.9 /100 | #88 | Exceptional 22.0% |